Think of your Google Ads metrics as the vital signs for your online campaigns. They tell you what's working, what's not, and where your money is actually making a difference within the vast Google Ads ecosystem.
Key indicators like Click-Through Rate (CTR), Cost Per Acquisition (CPA), and Return on Ad Spend (ROAS) are the foundation. Getting a handle on these is the first real step to turning your Google Ads spend into predictable business growth.
Your Starting Point in Google Ads Metrics
Jumping into Google Ads without understanding its core metrics is like trying to fly a plane without an instrument panel. Sure, you're in the air, but you have no clue if you're heading in the right direction or straight into a storm.
This is why getting comfortable with these numbers isn't just a "nice-to-have"—it's essential for anyone who wants to grow their business with Google Ads. These metrics turn your campaign's raw activity into a clear story about what’s actually happening.
The market has already voted with its wallet. Digital channels now soak up a massive 72.7% of all advertising investment worldwide. That figure is set to climb past an estimated $790 billion in 2024, a trend that kicked into high gear back in 2020 and hasn't slowed down since. You can dig deeper into this global advertising shift in this detailed report.
Why Metrics Matter More Than Ever in Google Ads
In the old days, a lot of advertising success was based on educated guesses. Today, platforms like Google Ads give you a firehose of data, offering precise feedback on every single dollar you spend. This lets you constantly tweak and improve, turning advertising from a game of chance into a calculated science.
A solid grasp of these metrics is so important because it helps with:
- Budget Justification: You can walk into any meeting and show clear proof that your Google Ads dollars are bringing in real results.
- Strategic Optimization: The data points you to the weak spots. Is your ad copy falling flat? Is your landing page scaring people away? Metrics give you the clues you need to make targeted fixes within your Google Ads account.
- Competitive Edge: When you understand your data on a deeper level, you can make smarter and faster decisions than competitors who are just skimming the surface of their Google Ads reports.
The goal isn't just to run ads; it's to run profitable ads. Metrics are the language you use to define, measure, and achieve that profitability within the Google Ads ecosystem.
This image from Google's own site shows just how straightforward the process can be when you start with a clear objective.
It all circles back to your goal. What you want to achieve directly determines which Google Ads performance metrics will become the most important ones for your campaign.
Before we dive deep, let's get a quick overview of the essential metrics you'll be working with inside your Google Ads account. This table serves as a handy cheat sheet for the most common terms you'll encounter.
Key Google Ads Metrics at a Glance
| Metric | What It Measures | Why It's Important |
|---|---|---|
| Impressions | How many times your ad was shown on a screen. | Gauges the overall visibility and reach of your campaign. |
| Clicks | The number of times people clicked on your ad. | Shows that your ad was compelling enough to get a response. |
| CTR | The percentage of impressions that resulted in a click. | A key indicator of ad relevance and creative effectiveness. |
| CPC | The average amount you pay for each click on your ad. | Helps you understand and control your advertising costs. |
| Conversions | The number of desired actions taken (e.g., sales, sign-ups). | Measures the actual business results generated by your ads. |
| CPA | The average cost to acquire one conversion. | Ties your ad spend directly to the cost of getting a new customer. |
| ROAS | The revenue generated for every dollar spent on advertising. | The ultimate measure of your campaign's profitability. |
Think of these as your core building blocks. Every effective Google Ads strategy, no matter how complex, is built on a solid understanding of these fundamentals.
How Users Interact with Your Ads

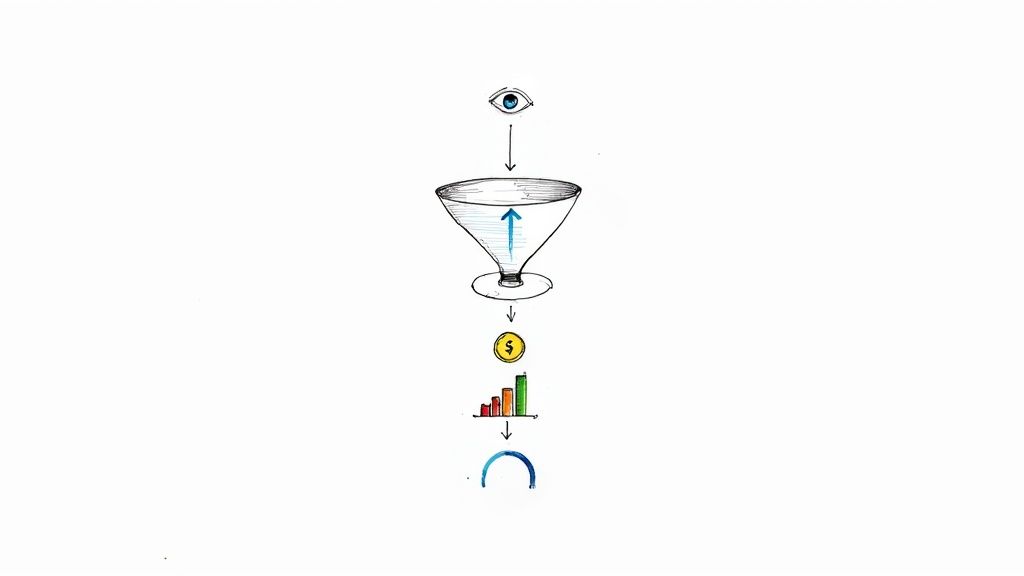
So, your Google Ads are live. Now what? They've just been released into a massive, bustling digital marketplace, and their very first test is simply to get noticed. The key to understanding if your campaigns are working starts right here, at the top of the funnel, by looking at how people initially engage with your ads.
Think of your ad as a storefront window on a busy street. Thousands of people walk by every day. Every single time your ad appears on someone's screen, that’s called an Impression. It’s purely a measure of visibility—how many eyeballs have seen your ad.
But you don’t want people to just walk past. You want them to stop, look, and come inside. When your ad is compelling enough for someone to actually engage with it, that’s a Click. This is a much stronger signal than an impression because it tells you someone was genuinely interested.
Decoding Click-Through Rate
The connection between these two metrics gives us one of the most vital signs of an ad's health: the Click-Through Rate (CTR). Simply put, CTR tells you what percentage of people who saw your ad actually clicked on it.
CTR = (Total Clicks / Total Impressions) x 100
A high CTR is a great sign. It means your ad creative, your message, and your targeting are all hitting the mark with your audience. On the flip side, a low CTR often signals a disconnect. It's like having that storefront window that thousands of people see, but almost no one bothers to stop and look at.
So, what’s a “good” CTR? That's the million-dollar question, and the honest answer is: it depends. The benchmark varies wildly by industry and ad type. For instance, a search ad for a very specific B2B service might do well with a CTR of 2-3%. A display ad, however, might be considered successful with a CTR under 1%. The real goal is to establish your own baseline and then work to improve it.
The Impact of CTR on Your Google Ads Account
Your CTR is far more than just a number to feel good about; it has a direct and powerful impact on your Quality Score. Think of Quality Score as Google's rating of the overall quality of your ads, keywords, and landing pages. A higher score can unlock lower ad costs and better placements.
Google wants to show its users relevant, helpful ads. A high CTR is a strong vote from users that your ad fits that description, and Google rewards you for it.
- Higher Ad Rank: A good Quality Score, which leans heavily on CTR, can push your ad higher up the search results page—often without you needing to bid more.
- Lower Cost Per Click (CPC): Google often gives advertisers with high Quality Scores a discount on their CPC. This means you pay less for every single click you get.
- Improved Ad Visibility: Better ad positions naturally lead to more impressions and more chances for clicks, creating a fantastic positive feedback loop for your campaign.
Actionable Tips for Improving Your CTR
If your CTR is lagging, it’s a clear signal that it’s time to make some adjustments. The issue could be your ad copy, your keyword targeting, or maybe the audience you're aiming for isn't quite right.
Here are a few proven strategies to give your CTR a boost:
- Refine Your Ad Copy: Make sure your headline and description are a direct answer to what the user is searching for. Always include your main keyword and a powerful call-to-action (CTA) like "Shop Now" or "Get a Free Quote."
- Use Ad Extensions: Sitelinks, callouts, and structured snippets are your friends. They add more useful information to your ad, making it physically larger and more eye-catching on the results page. This extra real estate can dramatically increase clicks.
- Implement Negative Keywords: This is a big one. Stop your ads from showing up for irrelevant searches by adding negative keywords. This simple step ensures your budget is only spent on qualified traffic, which almost always results in a higher CTR.
By zeroing in on these initial interaction metrics, you build a powerful foundation for your entire campaign. A healthy CTR is often the first domino to fall, leading to better Quality Scores, lower costs, and ultimately, more of the conversions you're after. Improving these top-of-funnel metrics is a critical part of mastering your Google Ads lead generation strategy.
How to Measure Advertising Cost Efficiency
Getting people to see and click your ads is a great start, but it's only half the story. Every single one of those clicks costs money. If you aren’t tracking your spending carefully, you can easily blow through your budget on a high-traffic campaign that doesn't deliver real results.
Think of cost efficiency metrics as your financial compass. They keep your Google Ads strategy pointed toward profitability and sustainable growth. The two most important metrics here are Cost Per Click (CPC) and Cost Per Acquisition (CPA).
They answer two very different, but equally critical, questions:
- "How much am I paying for someone's initial interest?"
- "How much am I paying to land an actual customer?"
Figuring out which of these to prioritize is the key to a smart bidding strategy. Are you trying to drive as much traffic to your website as possible? Or is your main goal to get leads and sales at a predictable cost? Your answer will tell you whether to focus on managing your CPC or your CPA.
Understanding Cost Per Click (CPC)
Cost Per Click, or CPC, is simply the price you pay every time someone clicks on your ad. It’s a direct measure of what it costs to get one person to visit your website or landing page. On Google Ads, this price is set in a real-time auction that weighs your bid against your Quality Score and what your competitors are willing to pay.
A lower CPC is generally a good thing—it means you can get more clicks, and therefore more potential customers, for the same amount of money.
But be careful. Chasing a rock-bottom CPC can be a trap. Bidding on cheap, low-intent keywords might bring in a flood of traffic, but if none of those visitors ever convert, you're just paying for window shoppers.
It's also important to see CPC in a broader context. Data shows that search ad costs have been creeping up for five years straight. But here’s the interesting part: this rise in CPC has been matched by an improvement in other digital advertising performance metrics. In fact, 65% of industries actually saw better conversion rates in 2025. This suggests advertisers are getting smarter about finding quality leads, even if it costs a bit more per click. You can dig into the latest Google Ads benchmarks and findings to see how these trends are playing out.
Mastering Cost Per Acquisition (CPA)
While CPC tracks the cost of a click, Cost Per Acquisition (CPA) goes deeper to measure the cost of what you really want: a conversion. A conversion is any action you deem valuable, whether that’s a completed sale, a submitted form, or a phone call.
Here’s the simple math behind it:
CPA = Total Cost of Campaign / Number of Conversions
CPA bridges the gap between ad spend and actual business results. It tells you exactly how much you're shelling out to acquire each new customer or lead from your campaigns.
It’s easy to assume that a lower CPA is always better, but that’s not the full picture. The real question isn't, "Is my CPA low?" It should be, "Is my CPA profitable?"
A $50 CPA might be a total disaster for someone selling a $40 product. But for a business with a $2,000 customer lifetime value, that same $50 CPA is an incredible win.
To use CPA the right way, you need to set a target CPA based on your own business’s numbers. Here’s a quick way to think through it:
- Know Your Value: First, how much revenue does a single conversion bring in?
- Calculate Your Margin: After accounting for all non-ad costs, what’s your actual profit on that conversion?
- Set Your Max CPA: Finally, decide how much of that profit you’re willing to spend to get that customer.
Let's say you sell a product for $100, and your profit margin is $40. Your break-even CPA is $40. To actually make money, your target CPA has to be less than $40. This simple exercise turns CPA from just another metric on a dashboard into a powerful tool for ensuring your advertising is actually growing your bottom line.
Measuring Your True Return on Ad Spend
Let's get to the heart of it: are your Google Ads actually making you money? Clicks and costs are useful health checks, but they don't tell you if you're profitable. To really understand your campaign's financial success, we need to talk about Return on Ad Spend (ROAS) and Conversion Rate (CVR).
Think of these two metrics as partners. ROAS tells you the direct financial return from your ad dollars, while CVR shows you how good you are at turning clicks into customers. You can't have one without the other.
The Critical Difference Between ROAS and ROI
Before we go any further, it's really important to clear this up: ROAS and ROI are not the same thing. They sound similar, but they measure completely different levels of profitability.
-
ROAS is your go-to metric for judging a specific ad campaign. It’s a simple, powerful calculation that asks, "For every dollar I spent on these ads, how many dollars in revenue did I get back?" It’s all about gross revenue versus ad cost.
-
ROI, on the other hand, is the big-picture business metric. It looks at the net profit after you account for all your costs—not just ad spend, but things like shipping, product costs, software, and even salaries.
If you need to show the full financial impact of your marketing efforts to the C-suite, it’s worth learning how to calculate marketing ROI. But for the day-to-day grind of managing your Google Ads, ROAS gives you the quick, clear feedback you need to make smart decisions.
Calculating and Interpreting Your ROAS
The math for ROAS is actually pretty simple. If you have conversion tracking set up correctly with revenue values, Google Ads will even handle the calculation for you.
ROAS = (Total Revenue from Ads / Total Ad Spend) x 100
The result is a percentage. For instance, if you spent $500 on a campaign that brought in $2,000 in revenue, your ROAS is 400%. Many marketers, including myself, find it easier to think of this as a 4:1 ratio. For every $1 we put in, we got $4 back.
Let's make it real. Say you run an e-commerce store selling custom phone cases.
- Ad Spend: You invest $1,000 in a Google Shopping campaign for the week.
- Revenue Generated: That campaign drives $4,000 in sales.
- Calculation: ($4,000 / $1,000) x 100 = 400% ROAS.
A 400% ROAS is a clear signal that this campaign is working. It's not just an expense; it’s a profitable engine for your business.
This image shows a comparison of different tools people use to track the data that feeds into metrics like ROAS, breaking down how often the data updates, what you can track, and the cost.
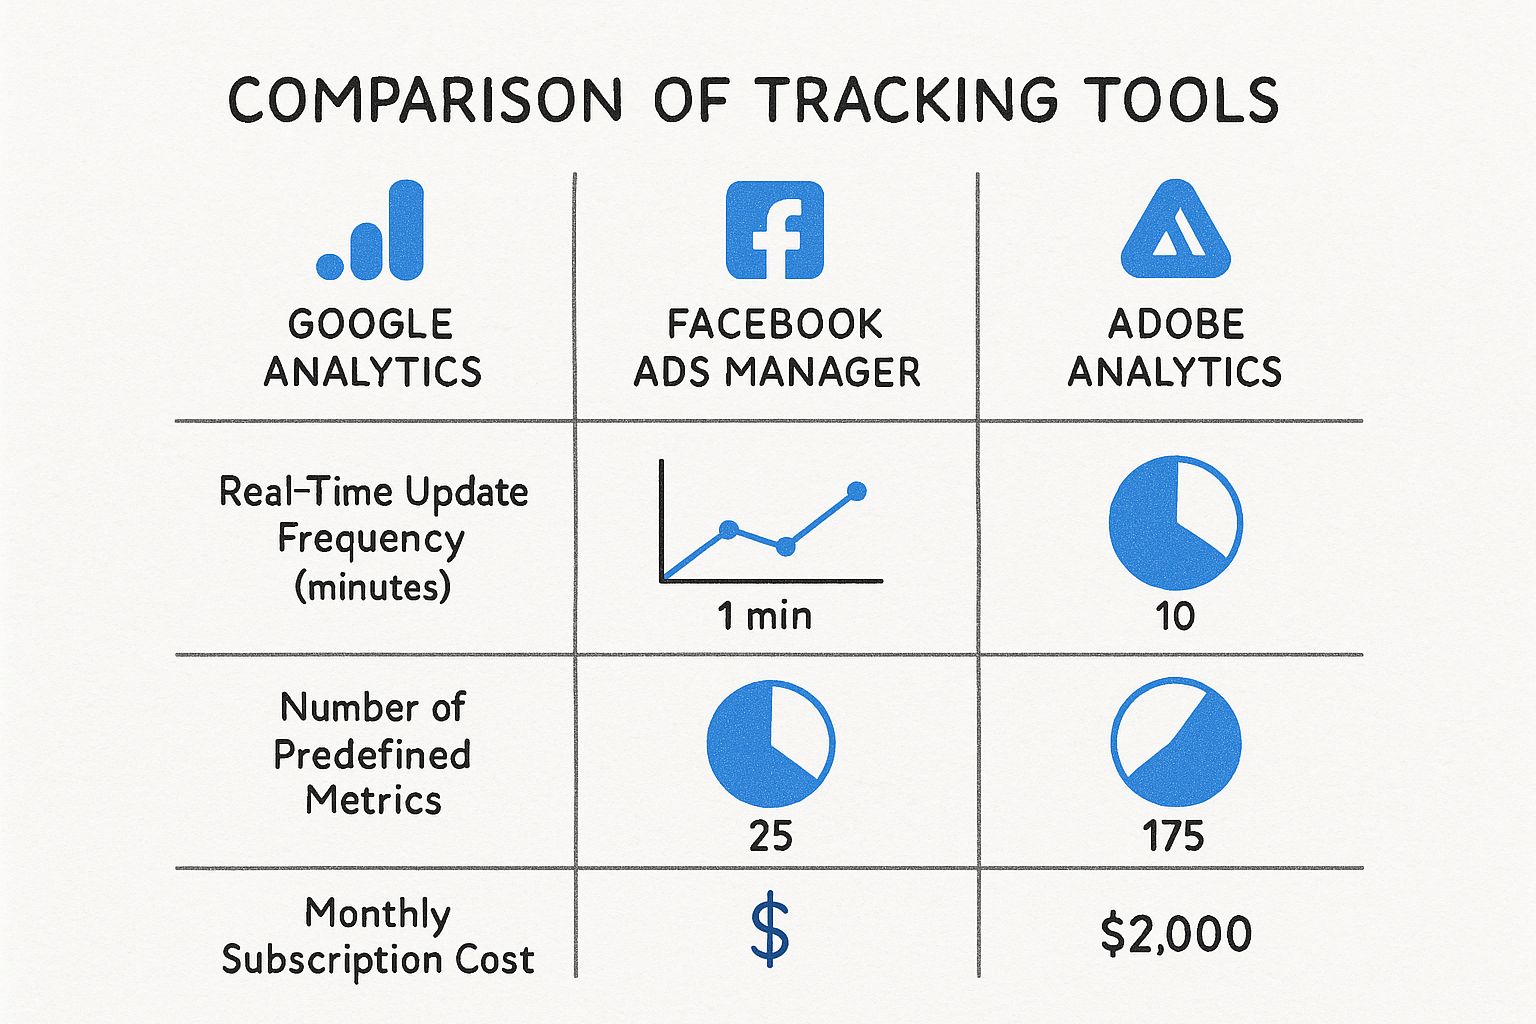
You can see there's often a trade-off. Some tools give you a ton of metrics but are slow to update, while others are faster but less detailed. It’s a classic choice between depth and speed.
Why Your Conversion Rate Is So Important
ROAS tells you the final score, but your Conversion Rate (CVR) tells you how you played the game. It’s the percentage of people who clicked your ad and then actually did what you wanted them to do—buy a product, fill out a form, or call your business.
It’s almost impossible to get a high ROAS with a poor conversion rate. Your CVR is a direct reflection of your landing page experience. If it's low, you're essentially paying to send potential customers to a dead end.
I’ve seen countless campaigns leak money because of simple, fixable issues that torpedo their conversion rates.
Common Conversion Rate Killers:
- Slow Page Load Speed: More than a couple of seconds to load? You’ve already lost them.
- Confusing Page Layout: If people have to hunt for the "buy now" button, they'll just give up.
- Weak Call-to-Action (CTA): "Submit" is boring. "Get Your Free Quote Now" is clear and compelling.
- Mismatch Between Ad and Landing Page: Your ad promised a 50% discount, but the landing page doesn't mention it. That's a surefire way to lose trust and the sale.
- Complicated Forms: Asking for their life story just to download a PDF? People will bounce.
When you pay attention to both ROAS and CVR, you create a powerful feedback loop. CVR helps you fix the leaks in your funnel, and ROAS confirms that those fixes are actually making you more money.
Building a Powerful Optimization Strategy

The metrics we've just covered don't exist in a vacuum. Think of them as individual pieces of a much larger puzzle. You can't see the full picture of your campaign’s health by looking at just one piece; you have to see how they all fit together.
For example, a sky-high Click-Through Rate (CTR) feels great, but it’s a vanity metric if none of those clicks ever turn into customers. On the flip side, an amazing Return on Ad Spend (ROAS) is what we all strive for, but it won't move the needle if your campaign has such a low impression volume that it barely runs.
Real optimization happens when you start to understand the story these numbers are telling you. This is the leap from just reporting data to actually using it to make smart decisions. To get there, it’s crucial to understand what data-driven decision-making entails, as this mindset is the foundation of any successful advertising strategy.
The move toward measurable digital channels isn't just a trend; it's a seismic shift. By 2025, digital advertising is on track to capture an incredible 75.2% of all ad spending worldwide, which adds up to about $777 billion. This explosion is fueled by the fact that we can track, measure, and optimize every dollar in a way that was never possible before.
Diagnosing Common Performance Scenarios
Let's put on our detective hats and walk through a few common situations you'll run into with your campaigns. The metrics are your clues, and your job is to use them to figure out what's really going on and how to fix it.
Scenario 1: High Clicks but Low Conversions
This one is a classic—and it's incredibly frustrating. People are clicking your ads, so the creative is working. But somewhere between the click and the conversion, they're getting lost.
- The Likely Culprit: Nine times out of ten, the problem is your landing page. There's a mismatch between the promise your ad made and the experience the page delivers.
- Questions to Ask Yourself: Does the page take forever to load? Is it obvious what the user should do next? Is the form asking for their life story? Does the page simply look unprofessional or untrustworthy?
- How to Fix It: Dive into Conversion Rate Optimization (CRO). Start A/B testing different headlines, try simplifying your forms, and make sure your ad copy and landing page message are in perfect sync.
Scenario 2: Low Impressions but High CTR and Conversions
This feels like you've found a hidden gem. When your ad does manage to show up, it works like a charm. The problem is, it's just not getting seen enough. You have a winning formula that's being held back.
- The Likely Culprit: You're probably being held back by your budget or your bids. Either you're not spending enough to compete, or you're bidding too low to win auctions consistently. You might also be targeting an audience that's just too small.
- Questions to Ask Yourself: Is your campaign dashboard showing a "limited by budget" warning? Are your ads always showing up at the bottom of the page?
- How to Fix It: Try carefully increasing your daily budget. Nudge your bids up for your best keywords. You could also think about broadening your targeting just a little to reach more of the right people.
Your goal is to move from being a data collector to a data interpreter. The numbers tell a story about user behavior, and your job is to listen to that story and react accordingly.
Creating Your Optimization Framework
To keep from getting overwhelmed by all the data, you need a system. A simple, repeatable framework helps you focus your energy where it will make the biggest difference.
- Start at the Top of the Funnel: Always begin with your Impressions and CTR. If people aren't seeing your ads or aren't compelled to click them, nothing else you do will matter.
- Move to Cost Efficiency: Next, zoom in on your CPC and CPA. Are you paying a sustainable price for each click and each conversion? This is all about making sure your campaign is built to last.
- End with Profitability: Finally, look at your ROAS. This is the bottom line. A healthy ROAS tells you that the entire system—from the initial impression to the final sale—is working together to make you money.
By working your way down this funnel, you can pinpoint the exact bottleneck that's holding your campaign back. This stops you from making random tweaks and hoping for the best. Instead, you can make targeted, informed changes that lead to real, measurable growth.
A Few Common Questions
Diving into digital advertising performance metrics can feel like learning a new language. But don't worry—most advertisers run into the same handful of questions. Let's clear up some of the most common ones so you can feel more confident reading your campaign data.
What's a Good ROAS for Google Ads?
This is the million-dollar question, but the honest answer is: it depends entirely on your business. There's no magic number that works for everyone.
You'll often hear a 4:1 ratio—that's $4 back for every $1 spent—tossed around as a general benchmark. But treat that as a starting point, not a rule. A business selling high-margin software might be perfectly happy with a 3:1 ROAS, while a retailer with razor-thin margins might need a 10:1 ROAS just to break even.
Your first job is to figure out your own break-even point. Once you know the absolute minimum ROAS you need to cover your costs, you can set a target that actually grows your business instead of just keeping the lights on.
How Often Should I Be Checking My Metrics?
The right answer here depends on how old your campaign is and how much you're spending. It's all about finding a balance between staying on top of things and overreacting to daily noise.
- For brand new or high-budget campaigns: You’ll want to check in daily. This lets you catch any big problems—like a budget running away or a sudden drop in performance—before they do real damage.
- For mature, stable campaigns: Looking at the numbers 2-3 times a week is usually plenty. This gives you enough data to spot meaningful trends without getting bogged down in the normal day-to-day ups and downs.
The golden rule is to avoid making major decisions based on just one day of data. Performance always fluctuates. Look at trends over 7, 14, or even 30 days to make smart, informed choices.
Which Metric Is the Most Important One?
Everyone wants to find that one "magic metric," but the truth is, the most important metric is always the one that aligns with your campaign's goal. What are you actually trying to accomplish?
Let me give you a few examples:
- Running an E-commerce store? ROAS is your north star. It directly ties your ad spend to the money coming in.
- Trying to generate leads? You'll live and die by your Cost Per Acquisition (CPA). This tells you exactly what it costs to get a potential customer's information.
- Focused on brand awareness? You’ll care more about metrics like Impressions, Reach, and Video View Rate. The goal is getting eyeballs, not immediate sales.
Always start with your objective. Once that's crystal clear, the digital advertising performance metrics that truly matter will naturally come into focus.
Tired of manually downloading leads from Google Ads every day? Pushmylead instantly sends every new lead from your Google Ads lead form extensions straight to your inbox. Stop wasting time and start converting leads faster. Get started at https://www.pushmylead.com.