A proper customer acquisition cost calculation is pretty straightforward: you divide your total sales and marketing costs by the number of new customers you brought in over a specific time. Where a lot of advertisers go wrong, though, is thinking this is the same as their cost-per-conversion in Google Ads. That’s a critical mistake that hides what it really costs to win a new customer.
Why Your True Google Ads CAC Is More Than Just Ad Spend
Before you even think about opening a spreadsheet, let's reset how you view Customer Acquisition Cost (CAC) in your Google Ads strategy. Just glancing at the "Cost" column in your account dashboard gives you an incomplete—and frankly, misleading—picture of your profitability.
The figure you see in Google Ads is usually your cost-per-action (CPA) or cost-per-conversion. It’s a useful metric, for sure, but it only shows your direct ad spend. It completely ignores the full range of resources you poured into turning that initial click into a paying customer. This blind spot can easily make an unprofitable campaign look like a winner, leading you to waste money and miss out on real growth.
Uncovering the Hidden Costs in Your Calculation
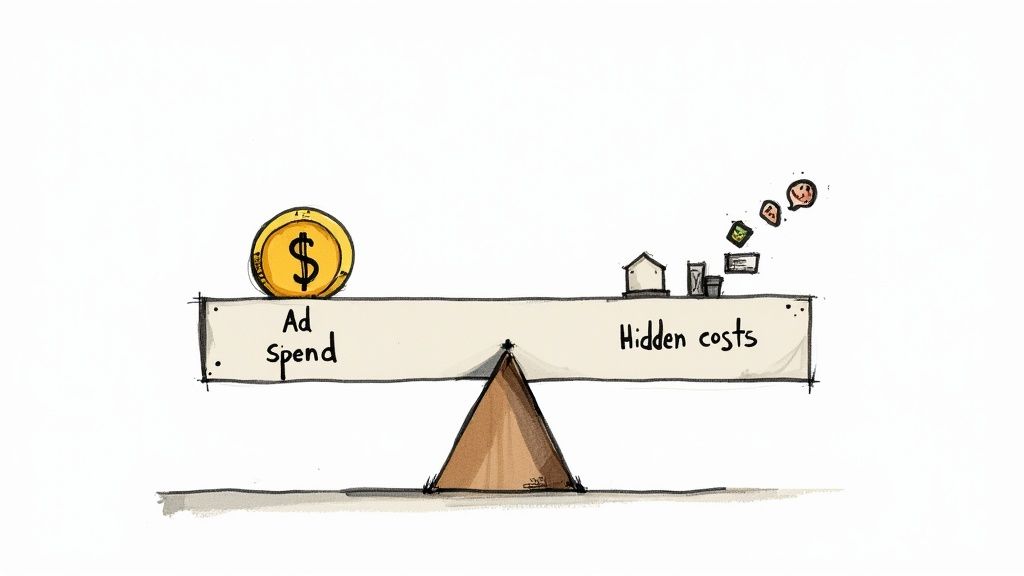
To get your actual customer acquisition cost, you have to look beyond the platform. The real number includes all the other expenses that keep your campaigns running.
Think about all these often-forgotten costs:
- Agency or Freelancer Fees: If you’ve hired help to manage your campaigns, their fees are a direct cost of getting customers.
- In-House Team Salaries: A portion of your PPC manager's or marketing team's salary needs to be factored into your Google Ads efforts.
- Creative Development: This covers everything from designing display ads and producing YouTube videos to hiring copywriters for your ad text.
- Software Subscriptions: Are you using tools for bid management, analytics, keyword research, or landing page optimization? Those are part of your acquisition toolkit, too.
These "soft" costs can add up quickly and dramatically increase your real CAC. If you ignore them, you're making decisions based on bad data, and you'll never know if your ad spend is actually delivering a positive return.
Why This Matters More Than Ever
Nailing down your complete CAC isn’t just good practice anymore; it’s essential. Competition is fierce and ad prices are always on the rise, making every dollar count. One report I came across showed that the average Customer Acquisition Cost shot up by about 222% between 2013 and 2025. The same analysis found that by 2025, the average company could lose around $29 for every new customer they acquire if their strategy is inefficient. You can discover more insights about these rising acquisition costs in the full report.
Once you get a firm handle on every single associated expense, you build a solid foundation for measuring what's actually working. This clarity is what lets you optimize campaigns with confidence, set realistic budgets, and drive sustainable, profitable growth for your business.
The Complete Formula for Calculating Google Ads CAC
While the basic idea behind Customer Acquisition Cost (CAC) is simple enough, calculating it accurately for your Google Ads campaigns is where things get tricky. The core formula is always your total costs divided by the new customers you brought in over a certain period.
The real challenge? Defining "total costs."
Too many businesses make the mistake of just looking at their ad spend in the Google Ads dashboard. That’s a good start, but it's only one piece of the puzzle. To get a true, actionable CAC, you have to account for every single dollar that went into acquiring those customers through Google Ads. This means digging deeper to get the full financial picture.
Identifying Every Cost Variable
A truly accurate CAC calculation requires a bit of detective work. You need to round up all the expenses tied to your Google Ads efforts, which often extend far beyond what you pay Google directly.
A complete list of your costs should include:
- Total Google Ads Spend: This is the obvious one, pulled straight from your campaign reports.
- Salaries and Fees: Are you paying a PPC manager or an agency? You need to factor in their salary or retainer fees.
- Software Subscriptions: Think about any tools you use for keyword research, bid management, analytics, or landing page creation. Their costs count, too.
- Creative Production: Don't forget what you spent on designing display ads, shooting product photos, or producing a video for a YouTube campaign.
This infographic lays out the process of gathering these costs and plugging them into the formula.
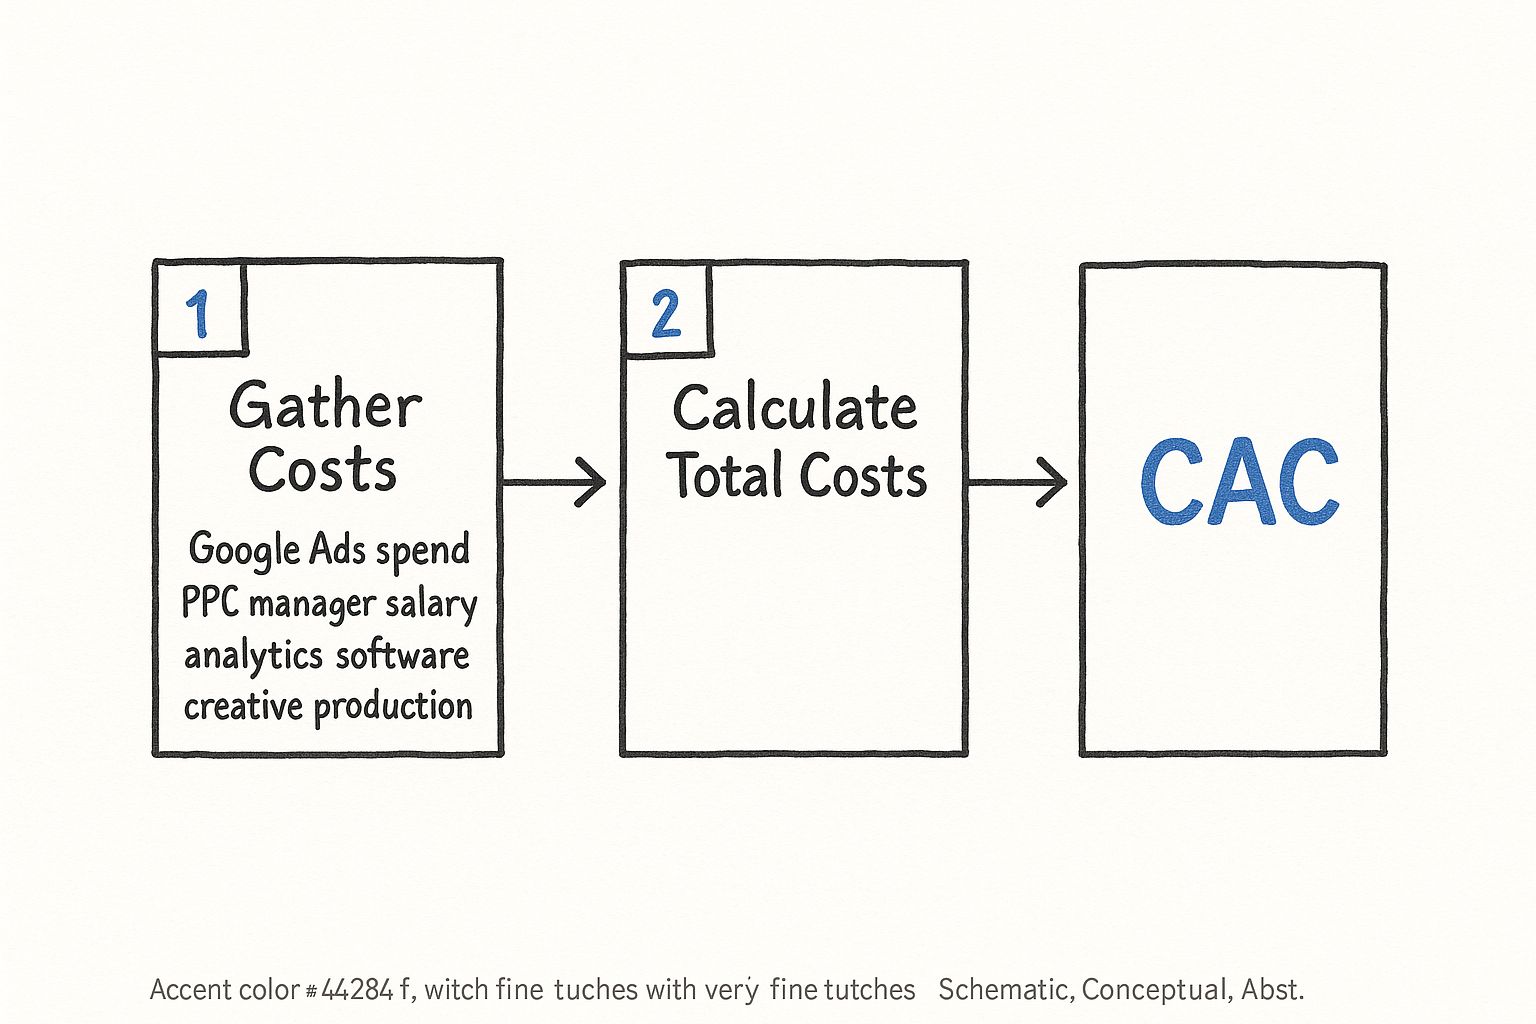
As you can see, it’s a clear three-step flow: gather all your costs, count your new customers, and then do the final calculation to get your true CAC.
To make sure you don't miss anything, it helps to break down all the potential expenses that go into a Google Ads campaign.
Google Ads CAC Calculation Components
| Cost Category | Description | Example |
|---|---|---|
| Direct Ad Spend | The total amount billed by Google for clicks, impressions, or conversions. | $10,000 spent on a Shopping campaign in one month. |
| Management Costs | Salaries for in-house staff or fees for external agencies/freelancers managing the account. | A portion of a marketing manager's salary (e.g., 25%) or a $2,500 monthly agency retainer. |
| Technology & Tools | Subscriptions for software used to support your Google Ads campaigns. | Monthly fees for tools like Semrush, Ahrefs, or Unbounce. |
| Creative Development | One-time or ongoing costs for creating ad assets like images, videos, and ad copy. | $500 paid to a graphic designer for a set of display ads. |
| Overhead | A portion of general business overhead that supports the marketing team. | A small percentage of office rent or utilities attributed to the PPC manager. |
By thinking through each of these categories, you ensure no hidden costs are throwing off your calculations.
Putting the Formula into Practice
Let's walk through a real-world example. Imagine you run a B2C e-commerce store selling handcrafted leather goods and you want to calculate your CAC for last month's Google Shopping campaigns.
First, you'd gather up all your costs for the month:
- Google Ads Spend: $10,000
- PPC Manager Salary (allocated 25% of their time): $1,500
- Analytics Software Subscription: $100
- New Product Photography for Ads: $400
Next, you add everything together to find your total investment: $10,000 + $1,500 + $100 + $400 = $12,000.
Finally, you check your conversion tracking and see that you acquired 200 new customers from these campaigns last month.
Now, you can plug those numbers into the formula: $12,000 / 200 = $60 CAC.
This $60 is your real CAC. If you had only used your ad spend, you'd have calculated it as $50 ($10,000 / 200). That's a 20% miscalculation that could seriously mislead you when you're making decisions about profitability and budget.
For e-commerce businesses, getting this number right is everything. As of 2025, the average CAC in e-commerce can fall anywhere between $68 and $78. This benchmark includes all the "hidden" costs like salaries and software, not just ad spend. Seeing how your numbers stack up against industry averages can tell you a lot about your own efficiency.
If you're looking for a way to streamline this process and avoid spreadsheet errors, using a dedicated customer acquisition cost calculator can be a huge help. It ensures you're consistently tracking all the right variables every single time.
Finding Accurate Data in Your Google Ads Account
Knowing the customer acquisition cost calculation is the easy part. The real challenge? Finding clean, reliable data to actually plug into the formula. Your Google Ads account is a goldmine of data, but you have to know where to dig. Just grabbing the total cost and total conversions from your main dashboard is a surefire way to get a skewed CAC.
The first thing you absolutely have to do is separate your new customer acquisition campaigns from your re-engagement or retention campaigns. Think about it—many accounts run branded search campaigns that mostly just capture people who are already looking for them. If you lump that spend and those conversions in, your CAC will look artificially low. It paints a misleading picture of how effective your outreach to new people really is.
Building Reports to Isolate New Customer Data
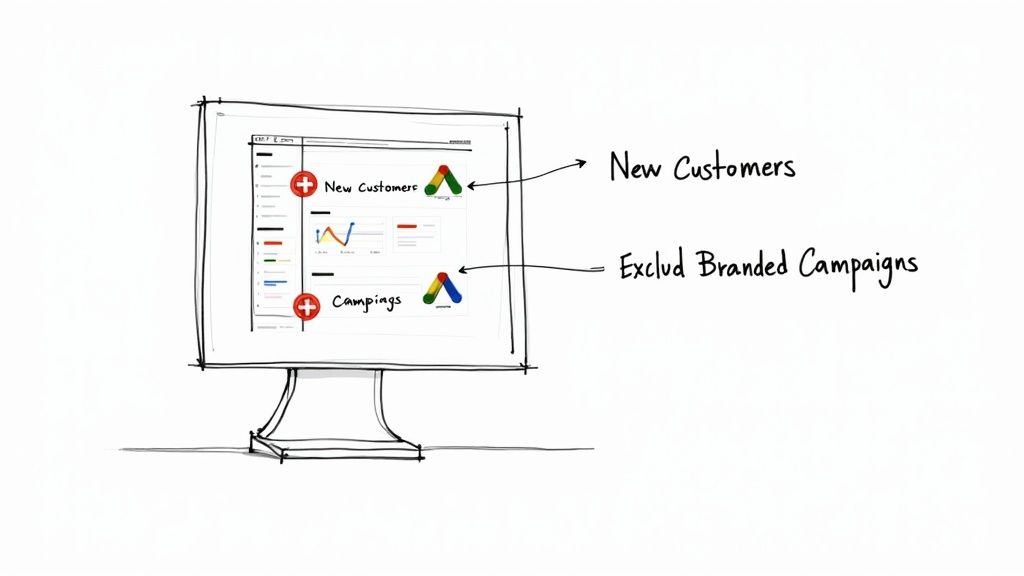
To get a true picture, you’ll need to build custom reports right inside the Google Ads interface. This is how you can filter out all the noise and focus only on the campaigns doing the heavy lifting of acquisition.
Head over to the "Reports" section in your Google Ads account and start a new custom report. This is where you can apply filters to zero in on the right campaigns.
- Filter by Campaign Name: I can't stress this enough—use a consistent naming convention. Something like "ACQ – Search – Product A" makes it incredibly easy to filter for all your acquisition efforts later on.
- Filter out Branded Terms: This is non-negotiable. Create a filter that excludes any campaigns with your brand name. This one move instantly cleans up your data by removing most of your returning customers.
- Focus on Top-of-Funnel Campaigns: You’ll want to isolate your non-branded Search, Shopping, and Performance Max campaigns—the ones specifically targeting cold audiences who haven't heard of you yet.
Following this process ensures the "Total Costs" figure in your formula only includes money spent to attract genuinely new customers. If you want to go deeper on this, we have a detailed guide on the most important digital advertising performance metrics.
Making Sure Your Conversion Data is Spot On
Just as you isolated your costs, you need to be certain your "New Customers Acquired" number is correct. This comes down to having solid conversion tracking that knows the difference between a first-time buyer and a repeat customer.
A common mistake I see is counting every single conversion as a new customer. If one person clicks an ad and makes three separate purchases, many accounts will mistakenly count that as three "new" customers. This will completely throw off your CAC.
The best way to handle this is to set up a specific "New Customer Purchase" conversion action. This usually involves passing a unique customer ID from your CRM or ecommerce platform (like Shopify) to Google Ads. When a purchase happens, your backend system checks if that customer has bought before. If they haven't, it fires the "New Customer" conversion tag. Simple.
And don't forget about offline conversions. If a lead you got from a Google Ad ends up closing the deal over the phone or in person, you have to import that data back into Google Ads. This is the only way to connect your ad spend to the final revenue, giving you a complete, accurate customer acquisition cost.
How to Analyze CAC Across Different Campaign Types
Here's a hard truth: a single, blended customer acquisition cost calculation for your entire Google Ads account is a vanity metric. It looks clean on a report, but it tells you almost nothing about what’s actually working.
The real magic happens when you start segmenting. You need to break down your CAC by campaign type, because not all campaigns are created equal. A high-intent Search campaign targeting competitor keywords has a completely different job—and cost structure—than a broad Display campaign meant for brand awareness. Lumping them together just muddies the waters. Real optimization starts when you look at each one individually.
High-Intent vs. Top-of-Funnel Campaigns
Let's walk through a common scenario for a B2B SaaS company. This business is running a few different campaigns in Google Ads, each with a specific goal.
- Campaign A (Search): This one goes after users actively searching for direct competitors, using keywords like "alternative to [competitor name]." The clicks are pricey, no doubt, but the leads are red-hot and ready to buy.
- Campaign B (Display): This campaign is all about building awareness. It uses in-market audience targeting to show banner ads to professionals in a specific industry. These leads are much colder and sit at the very top of the funnel.
When you crunch the numbers, you might find that Campaign A has a $450 CAC, while Campaign B's CAC is only $150. On the surface, Campaign A looks three times less efficient. But that’s a dangerously simplistic view.
This is where the bigger picture comes in. What if the customer lifetime value (LTV) from that high-intent Search campaign is $5,000, while the LTV from the "cheaper" Display campaign is just $1,000? Now the story has completely changed.
This is a critical lesson for any advertiser: a higher CAC isn't automatically a bad thing. If the campaign is acquiring more valuable customers, a higher acquisition cost can be completely justified and, in fact, far more profitable in the long run.
This kind of segmented analysis is especially crucial for B2B businesses. The sales cycles are longer, the decision-making is more complex, and the CAC is just plain higher than in B2C. It's not unusual for a SaaS business to see an average CAC anywhere from $200 to over $700. It simply costs more to educate and win over specialized customers. You can dive deeper into these figures and learn more about B2B CAC benchmarks to see how you stack up.
Sample CAC by Google Ads Campaign Type (B2B SaaS Example)
To illustrate how this plays out, let's look at a hypothetical B2B SaaS company's Google Ads account. The table below shows how wildly different the CAC can be, and why each campaign still has a vital role.
| Campaign Type | Typical Funnel Stage | Average CAC | Strategic Role |
|---|---|---|---|
| Branded Search | Bottom of Funnel | $50 – $150 | Capture high-intent users already looking for you. |
| Competitor Search | Bottom of Funnel | $400 – $800+ | Steal market share from direct competitors at the point of decision. |
| Problem/Solution Search | Middle of Funnel | $250 – $500 | Educate users aware of their problem but not your solution yet. |
| Display/YouTube | Top of Funnel | $100 – $300 | Build brand awareness and fill the pipeline with new prospects. |
As you can see, judging the $800+ CAC from a competitor campaign against the $150 CAC from a Display campaign is an apples-to-oranges comparison. Each serves a different purpose and delivers a different quality of lead.
Using CAC Data to Steer Your Budget
Once you break down your customer acquisition cost calculation by campaign, you can start making genuinely smart budget decisions. You’ll finally have a clear view of which channels are your heavy hitters for high-value customers and which are your workhorses for cost-effective pipeline building.
This level of analysis empowers you to:
- Confidently spend more on bottom-of-funnel campaigns like branded or competitor Search, because you can prove they deliver customers with a higher LTV.
- Set realistic goals for top-of-funnel campaigns like Display or YouTube, understanding their job is to create future demand, not immediate profit.
- Shift your budget intelligently toward campaigns that deliver the best LTV-to-CAC ratio, not just the lowest raw CAC.
At the end of the day, your LTV to CAC ratio is the true north star. Analyzing it at the campaign level transforms CAC from a simple reporting number into a powerful strategic tool you can use to drive profitable growth.
How to Get Your Google Ads CAC Down
Once you've nailed down your customer acquisition cost, the real fun begins: shrinking that number. Lowering your CAC isn't about gutting your budget; it’s about getting smarter and more efficient with every dollar you spend.
The first place I always look is the keyword strategy. You can burn through cash incredibly fast by paying for clicks that have zero chance of converting. It's time to get aggressive with your negative keyword lists.
Make it a weekly habit to dig through your search terms report. If you see a query that doesn't fit a buyer's intent, add it to your negatives immediately. For instance, if you sell high-end "carbon fiber road bikes," you absolutely don't want to pay for clicks from searches like "free bike giveaway" or "bicycle repair." Those are budget killers.
Improve Your Ad Relevance and Quality Score
One of the most powerful tools you have for cutting costs is your Quality Score. It's Google's way of rewarding you for a great user experience. A high score leads to a lower cost-per-click (CPC) and better ad placements—it's a direct win.
To get your score up, focus on these three core pieces:
- Ad Relevance: Your ad copy needs to be a mirror image of the keywords in your ad group. If someone searches for "noise-canceling headphones for travel," that phrase should be right there in your headline.
- Expected Click-Through Rate (CTR): Write ad copy that people actually want to click. Use compelling language and take up more screen real estate with ad extensions like sitelinks, callouts, and structured snippets.
- Landing Page Experience: The page a user lands on after clicking your ad has to deliver. It must load quickly, look great on mobile, and make it ridiculously simple for them to take the next step.
A high Quality Score isn't just a number to brag about. It directly lowers your CAC by making each qualified click cheaper, which fundamentally improves your entire campaign's efficiency.
Dial-In Your Bidding and Targeting
Finally, let Google's own tools do some of the heavy lifting for you. Once you have a reliable CAC, you can put it to work with a Target CPA (tCPA) bidding strategy.
By setting your target CPA just a bit lower than what you're currently paying, you challenge the algorithm to find more conversions for less money. You’re essentially telling Google's machine learning, "This is the max I'm willing to pay for a customer, go find them."
Don't forget about your audience targeting, either. Remarketing lists are pure gold. These are people who have already visited your site, so they know who you are. Bringing them back is almost always cheaper than acquiring a brand-new customer. By segmenting these audiences and speaking directly to them, you can boost conversion rates and make a serious dent in your CAC.
For a deeper dive into refining your campaigns, check out this excellent Google AdWords PPC optimization guide.
Tying Your CAC Back to the Big Picture
Figuring out your Google Ads CAC isn't just a box-ticking exercise for your marketing reports. This number is your direct line from campaign clicks to the company's bottom line. It's the key that unlocks smarter, more profitable decisions across the board.
Once you know what it truly costs to get a new customer, you can stop focusing solely on metrics like click-through rates and start talking about what really matters: profitability and return on investment. This is how you justify your marketing budget and prove to the higher-ups that your Google Ads campaigns are a powerful engine for growth.
Your North Star: The LTV to CAC Ratio
The real magic happens when you compare your CAC to another crucial metric: Customer Lifetime Value (LTV). The LTV to CAC ratio is the ultimate health check for your marketing efforts. It tells you exactly how much value you're creating over the long haul for every single dollar you spend to bring someone in the door.
A healthy LTV to CAC ratio is widely considered to be 3:1. For every dollar you put into acquisition, you get three dollars back in lifetime revenue. That’s a solid, sustainable business.
- A 1:1 ratio is a major red flag. You're essentially breaking even on every new customer, which means you're not actually growing. It's an unsustainable treadmill.
- A 4:1 ratio or higher is fantastic. This is a sign of an incredibly efficient marketing machine and a clear signal to double down and invest more in what's working.
This simple ratio takes the guesswork out of budgeting and replaces it with a data-backed roadmap for scaling your business responsibly.
When a Higher CAC Is Actually a Good Thing
It’s natural to assume that the lowest possible CAC is always the goal. But that’s a common misconception. Sometimes, a higher acquisition cost isn't just acceptable; it's a brilliant strategic move. Having solid CAC data is what gives you the confidence to make these calculated bets.
Think about these real-world scenarios:
- Breaking into a New Market: When you're the new kid on the block, you have to spend more. Your initial CAC will almost always be higher as you build brand recognition and learn the local ropes. It's a short-term investment for long-term expansion.
- Targeting a High-Value Customer: What if you find that a specific, more expensive keyword brings in customers who spend twice as much over their lifetime? In that case, paying a premium to acquire more of them is a no-brainer for boosting overall profitability.
When you look at CAC through the lens of your business goals, it stops being just another metric. It becomes your guide for making intelligent investments that fuel real, sustainable growth.
Answering Your Top Questions About Google Ads CAC
When you start digging into your Google Ads customer acquisition cost, a few key questions almost always pop up. Getting these right is the difference between having a bunch of numbers and having a real strategy for growth. Let's tackle some of the most common ones I hear from advertisers.
How Often Should I Be Calculating My CAC?
For most businesses, running the numbers monthly is the sweet spot. It gives you a regular pulse on your performance, letting you spot trends and make smart tweaks without getting lost in the day-to-day noise.
But that’s not a hard-and-fast rule. The real answer depends on how long it takes someone to become a customer.
- Fast-Paced Businesses: If you're in e-commerce or anything with a short sales cycle, you might want to check your CAC weekly. When things move fast, you need to be able to react just as quickly.
- Long-Term Sales: For B2B companies where a deal can take months to close, a quarterly calculation often makes more sense. It aligns your ad spend with the revenue it actually generated, giving you a much truer picture.
What’s a Good LTV to CAC Ratio for Google Ads?
This is the big one. Your LTV (Lifetime Value) to CAC ratio tells you if you're actually making money from your ads. The gold standard that most sustainable businesses aim for is at least 3:1.
Put simply, for every dollar you put into Google Ads to get a customer, you should be getting at least three dollars back from them over their lifetime.
If your ratio is 1:1, you’re in the danger zone. You’re essentially spending a dollar to make a dollar, and that’s before you even think about your other business costs. On the flip side, if you're hitting a 4:1 or 5:1 ratio, that's a brilliant signal to double down and scale up your Google Ads budget.
My Sales Cycle Is Long. How Do I Factor That into My CAC?
This is a fantastic and crucial question. If someone clicks an ad in January but doesn't sign on the dotted line until March, a simple monthly calculation will make your CAC look terrible. You're mismatching your costs and your results.
The fix here is to use what’s called a time-shifted or lagged CAC model. You're essentially creating a delay in your formula to match your sales cycle.
So, if your average sales cycle is 90 days, you wouldn't look at January's ad spend and January's new customers. Instead, you'd take your ad spend from Q1 and divide it by the new customers you actually acquired in Q2. It’s a bit more work, but it gives you a far more accurate and honest look at how effective your ad spend really is.
Stop losing valuable leads from your Google Ads campaigns. Pushmylead instantly sends lead form submissions from Search, Discovery, and YouTube ads directly to your inbox, so you can follow up in minutes, not hours. See how it works at https://www.pushmylead.com.