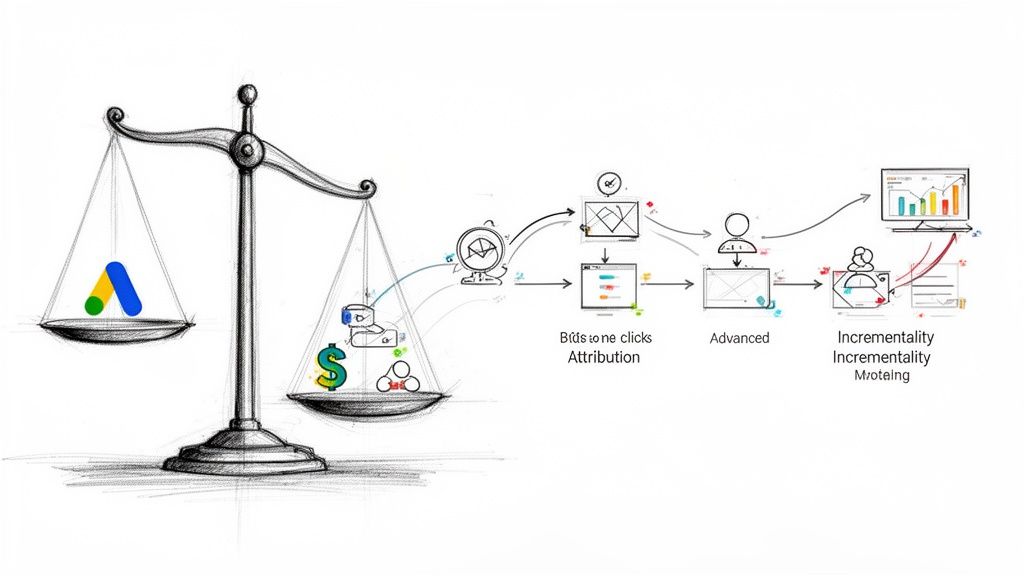
When we talk about real advertising effectiveness, we're not just counting clicks. We're talking about drawing a straight line from your Google Ads budget directly to what matters most: qualified leads, closed sales, and actual revenue in the bank. It's about getting past the shallow data points to see the real financial story your campaigns are telling.
Moving Beyond Clicks to Measure Real Business Impact
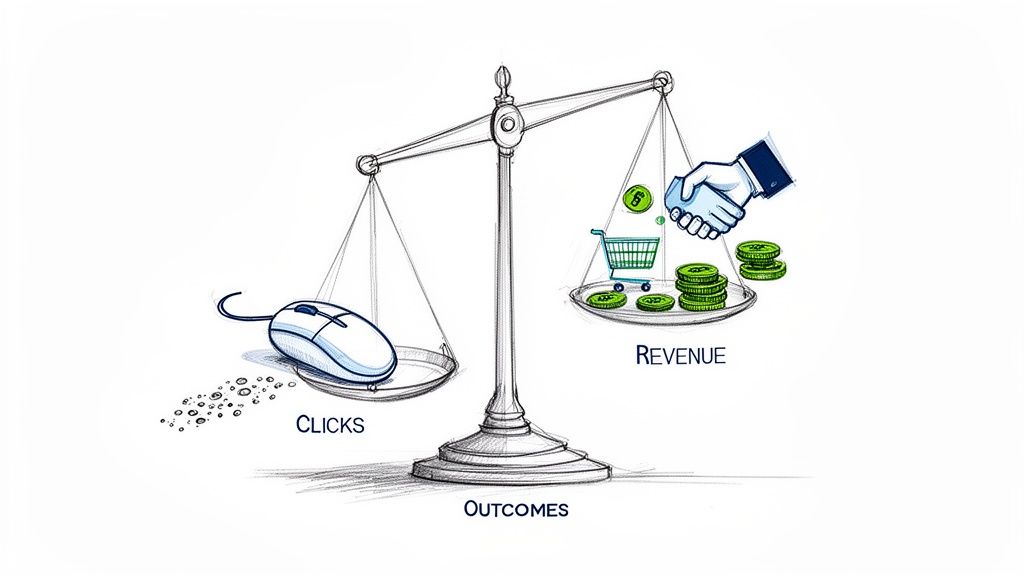
For a long time, the digital marketing world was obsessed with simple metrics. A high click-through rate (CTR) or a low cost-per-click (CPC) was the gold standard, the sign of a "successful" campaign. But as many of us learned the hard way, these can be vanity metrics that don't paint the full picture.
Think about it: a campaign can get thousands of clicks and look amazing on a surface-level report, but if it generates zero sales, it's just an expensive exercise in getting noticed. This guide is all about leaving that old mindset behind and adopting a framework that delivers deep, meaningful insights.
The Shift to Business-Centric Measurement
The game has changed. Today, the goal is to prove return on investment (ROI) with cold, hard data. This isn't just a tweak; it’s a complete strategic shift that connects every dollar you spend in your Google Ads account to a concrete business outcome. To really get a grip on this, you have to adopt more complete approaches, like data-driven marketing strategies.
This shift is especially critical if you're an agency or consultant. Your clients want to see value, and that means looking at the entire customer journey—from the very first ad they see to the moment they become a loyal customer.
This concept isn't exactly brand new. The connection between consistent ad spend and results has been studied for decades. Back in 1966, foundational research showed that brands that consistently invested above their normal ad budget saw significantly higher brand awareness over time compared to those that cut corners.
This long-view perspective is exactly why tracking deeper metrics is so important. It’s not just about winning the click today; it's about building brand value that pays off for years to come.
Why Advanced Models Are Now Essential
To get this level of clarity, the standard Google Ads dashboard just won't cut it anymore. True measurement means bringing different data sources together and using smarter models to analyze them.
Here’s what that looks like in the real world:
- Integrated Data Workflows: You need to connect the dots. Linking Google Ads with your CRM and Google Analytics 4 (GA4) is how you create a complete view, tracking the journey from ad click to final sale.
- Incrementality Testing: This is how you prove your ads are actually causing sales. It helps you figure out how many conversions would have happened anyway versus those that happened only because someone saw your ad.
- Lead-to-Revenue Tracking: It’s about following the money. You track a lead from the moment it comes in, watch its journey through your sales pipeline, and see if it ultimately becomes a paying customer.
By putting these methods into practice, you can finally answer the one question that truly matters: "Is my advertising actually growing the business?"
The Google Ads Metrics That Actually Matter
Before we can even talk about measuring success, we need to agree on what "success" actually looks like. That means picking Key Performance Indicators (KPIs) that tie directly to your business goals, not just vanity metrics that look good in a report.
Think of it like this: your customer goes on a journey, and your KPIs are the signposts along the way. We can group these signposts into three main stages: Awareness, Consideration, and Conversion. This framework helps you focus on what's important for any given campaign, whether you're trying to get your name out there, generate leads, or sell products online.
Awareness: Are People Even Seeing You?
The first hurdle is simple: getting noticed. Awareness metrics tell you if your campaigns are successfully reaching your target audience and making a first impression. These are your go-to numbers for brand-building campaigns, especially on Display, YouTube, and even Performance Max.
-
Impression Share: Think of this as your market share for eyeballs. It’s the percentage of times your ads were shown compared to the total number of times they could have been shown. If your Impression Share is low, it’s a red flag. You're either being outbid or your budget is too small, meaning you're missing out on a huge chunk of your audience.
-
Reach and Frequency: Reach is the number of unique people who saw your ad. Frequency is how many times, on average, each person saw it. It’s a delicate balance. You need enough frequency for your message to stick, but not so much that you annoy people into ignoring you completely.
These top-of-funnel metrics are your early warning system. They confirm you’re getting in front of the right people, which is the essential first step for anything else to happen.
Consideration: Did You Pique Their Interest?
Okay, they saw you. Now what? Did they care? Consideration metrics are all about measuring how people interact with your ads once they’ve seen them. This is where you find out if your message is actually compelling enough to earn a click, a video view, or some other sign of life.
A huge one here is Quality Score. It’s Google’s internal report card, grading your ads, keywords, and landing pages on a scale of 1 to 10. A high Quality Score isn't just for bragging rights; it directly leads to lower ad costs and better ad placements. It’s basically Google’s way of rewarding you for creating a good, relevant experience for users.
Another key metric, especially for visual formats like YouTube and Display ads, is Engagement Rate. This shows the percentage of people who didn't just see your ad but actually interacted with it.
An "engagement" isn't always a click. On YouTube, for example, a "view" is often counted only after someone watches for 30 seconds (or the whole ad if it's shorter). That's a powerful signal of genuine interest that goes way beyond a passive glance.
If your engagement numbers are in the gutter, it’s a clear sign that your creative or your targeting is off the mark. It's time to go back to the drawing board.
Conversion: Did You Get The Results You Paid For?
This is the bottom line. This is where your ad spend turns into real, measurable business results. Conversion metrics are the ultimate proof of whether your campaigns are working, connecting your ad dollars directly to sales, sign-ups, and qualified leads.
Here are the heavy hitters:
- Conversion Rate (CVR): The percentage of people who clicked your ad and then took the action you wanted them to. A strong CVR means your ad and landing page are working together perfectly to convince people to act.
- Customer Acquisition Cost (CAC): Simply put, how much does it cost you to get a new customer? You calculate this by dividing your total ad spend by the number of new customers you gained. It’s one of the most fundamental metrics in business.
- Return on Ad Spend (ROAS): This shows you the revenue you generated for every dollar you spent on ads. A 4:1 ROAS—meaning you make $4 for every $1 you spend—is often seen as a healthy benchmark, but your ideal target will depend entirely on your industry and profit margins.
When you look at your performance through these three stages—Awareness, Consideration, and Conversion—you get the full story. You can clearly see how well you're attracting an audience, how good you are at engaging them, and, most importantly, how effectively you're turning that engagement into cold, hard cash.
Key Google Ads Metrics by Campaign Goal
To make this even more practical, let's map these KPIs to common campaign goals. It's easy to get lost in the sea of data inside Google Ads, so having a clear focus helps you zero in on what truly drives success for your specific objective.
This table breaks down which metrics to prioritize based on what you're trying to achieve.
| Campaign Goal | Primary KPI | Secondary Metrics | What It Measures |
|---|---|---|---|
| Brand Awareness | Impression Share, Reach | Frequency, Video View Rate | How effectively you're reaching and being seen by your target audience. |
| Lead Generation | Conversions (Leads), CVR | Cost per Conversion (CPL) | The volume and efficiency of your campaigns in generating new leads. |
| E-commerce Sales | ROAS, Conversion Value | CVR, Average Order Value | The direct revenue and profitability generated from your ad spend. |
| Website Traffic | Clicks, CTR | CPC, Bounce Rate | Your ability to drive relevant, engaged users to your website. |
By aligning your reporting with the right set of KPIs from the start, you stop chasing meaningless numbers and start making decisions that directly impact your bottom line. It’s all about focusing on the metrics that matter for your goals.
Choosing Your Measurement Model: Attribution vs. Incrementality
Once you've nailed down your core KPIs, the next big question is how to give credit for your conversions. This is where measurement models come in, and two of the most important approaches are attribution and incrementality. They sound similar, but they tackle completely different problems.
Think of it like a soccer team scoring a goal.
Attribution is the play-by-play analysis. It’s like watching the game tape to see every single player who touched the ball on its way into the net. The goal is to understand how each touchpoint contributed to the final score.
Incrementality, on the other hand, asks a much bigger question: "Would we have scored that goal even if our star forward wasn't on the field?" It gets to the heart of true impact, measuring the conversions that happened only because your ad was there.
What Is Attribution Modeling in Google Ads?
Attribution modeling is simply the rulebook you use to assign credit to the different ads, keywords, and clicks that guide a customer to your business. If you don't have a clear model, you'll likely give 100% of the credit to the very last click before a purchase. That's a huge mistake, as it completely ignores all the earlier interactions that introduced someone to your brand in the first place.
For a long time, "Last Click" was the standard in Google Ads. It was simple, but it was also incredibly misleading. It completely devalued all the hard work your upper-funnel campaigns were doing to build awareness.
Thankfully, Google now offers much smarter ways to divvy up the credit:
- Linear: Spreads the credit out evenly across every single touchpoint. Simple and fair.
- Time Decay: Gives more credit to the touchpoints that happened closer to the conversion. The more recent the touch, the more credit it gets.
- Position-Based: This hybrid model gives 40% of the credit to the very first touch, 40% to the very last, and splits the remaining 20% among everything in between.
The best choice for most advertisers today is Google's Data-Driven Attribution (DDA). Instead of relying on a rigid, one-size-fits-all rule, this model uses machine learning to look at your account's actual conversion patterns. It figures out which touchpoints were genuinely the most influential for your customers, making it the most accurate and customized option available.
Understanding Incrementality: The True Test of Ad Impact
While attribution is perfect for fine-tuning your campaigns, incrementality answers the million-dollar question: are my ads actually bringing in new business, or am I just paying to connect with people who were going to buy from me anyway?
This model is all about measuring the causal lift from your advertising. It isolates the conversions that would have never happened without someone seeing your ad. For instance, you might run a campaign that generates 100 sales. But if an incrementality test reveals that 60 of those customers would have converted regardless, your true incremental lift is only 40 sales.
The idea behind incrementality is nothing new. It’s based on the classic test-and-control experiments that have been used in direct mail and TV advertising for decades. But to get statistically significant results, you need serious scale. As a rule of thumb, many experts suggest a minimum of 15 million impressions per campaign before even considering an incrementality study. You can learn more by checking out the best practices for ad effectiveness studies on iab.com.
Google Ads has built-in tools to help you run these tests, like Conversion Lift studies for YouTube and Display, and Geo Experiments for your Search and Shopping campaigns. These tools work by splitting your audience into a test group (who sees your ads) and a control group (who doesn't), giving you a clear, scientific measurement of the real-world impact your ads are having.
Using Attribution and Incrementality Together
This isn't an "either/or" situation. The smartest marketers use both models together to build a complete picture of performance. They answer different but equally vital questions, giving you both the tactical and strategic insights you need to win.
Here’s a simple way to think about how they work in harmony:
| Measurement Model | Primary Question Answered | Best For |
|---|---|---|
| Attribution | Which touchpoints were most influential in the conversion path? | Optimizing campaigns, keywords, and creative within your ad channels. |
| Incrementality | Did my ads cause new sales to happen? | Making strategic budget decisions and proving the true ROI of marketing to your CFO. |
By combining these two perspectives, you move from just seeing what happened to understanding why it happened. Attribution helps you make smarter day-to-day tweaks, while incrementality gives you the high-level proof needed to justify your ad spend and make bold, confident decisions about where to invest next.
Strategic Budgeting with Marketing Mix Modeling
If attribution and incrementality are about fine-tuning your individual ad channels, Marketing Mix Modeling (MMM) is like zooming out to see the entire battlefield. It’s a powerful statistical method that shows you how all your marketing efforts—from Google Ads to billboards—work together to drive sales.
Think of it like being a chef. You wouldn’t taste just the salt or just the pepper to judge a dish. You taste how all the ingredients combine. MMM does the same thing for your marketing budget, looking at the entire recipe for success, not just one ingredient in isolation.
Seeing the Forest for the Trees
MMM takes a completely different approach than user-level tracking. Instead of following individual customers, it analyzes big-picture data over a long stretch of time, often a few years. It crunches historical numbers on sales, ad spend across every channel (social, TV, search, print), seasonal trends, special promotions, and even external factors like the economy.
The whole point is to build a statistical model that shows how much each element contributed to your bottom line. This top-down view is incredibly useful because it can measure the impact of things that are impossible to track at a user level, like a radio ad or a sponsorship.
By looking at these broad patterns, MMM helps you answer the big, strategic questions that other measurement methods just can't touch.
For example, MMM can show you how a big push on YouTube ads led to a spike in people searching for your brand on Google. Or it might reveal how a 20% off sale made your Performance Max campaigns twice as effective. It connects all the dots.
This holistic view gives you the confidence to make major budget decisions, like shifting millions from one area of your marketing to another to get a better overall return.
The Data You Need to Get Started
To make MMM work, you need a solid foundation of data. The model learns from your history, so the more clean, organized data you can feed it, the smarter and more accurate it will be.
Here’s the essential shopping list:
- Sales Data: This is the most important piece. You'll need detailed historical sales numbers, usually broken down by week or month.
- Marketing Spend Data: Gather what you spent on everything. This includes Google Ads, social media campaigns, email marketing, PR, and any offline advertising.
- External Factors: This is where MMM really shines. You should include data on things like major holidays, big promotions you ran, competitor campaigns you were aware of, or even major economic shifts.
Pulling all this together can feel like a huge project, but the insights it unlocks are the kind that can truly shape the future of your business.
Answering the Million-Dollar Budget Questions
MMM is a beast when it comes to figuring out where your advertising dollars actually make a difference. In one well-known case, a company found that TV ads were eating up 85% of a new product's campaign budget. The model, however, showed that YouTube ads—which only got 6% of the spend—were almost twice as effective at getting people to search online and buy the product. That's the kind of insight that leads to game-changing budget shifts.
When you get your channel mix right, you see it in the results. It's no coincidence that top e-commerce brands often hit conversion rates of 4-5%; their campaigns are fine-tuned based on this kind of deep understanding. You can learn more about how to measure the impact of your ads on AdtWin.ai.
At the end of the day, MMM gives you the hard data you need to answer the questions that keep marketing and finance leaders up at night:
- What's the right budget for Google Ads? The model can forecast how your sales would change if you spent more (or less) on Google Ads, helping you find that sweet spot before you hit diminishing returns.
- How should we split our budget across channels? MMM clearly lays out the ROI for each channel, so you can confidently move money from things that aren't working to the things that are.
- What happens if we have to cut our budget by 20%? You can run simulations to see how different budget cuts would likely impact your overall sales, taking the guesswork out of tough decisions.
By adding MMM to your measurement toolkit, you graduate from just optimizing campaigns to making truly strategic decisions that get your entire marketing budget pulling in the same direction.
A Practical Workflow for Tying Leads to Real Revenue
All the theory in the world doesn't mean much until you put it into practice. Let's walk through how to build a rock-solid system that connects your Google Ads clicks all the way through to actual sales revenue. This is about trading guesswork for a clear story of what's working and what's not.
The whole point is to follow a customer from their very first ad click to the moment they hand over their money. When you do this, you can finally prove which campaigns are making the phone ring and which are just driving casual traffic.
Step 1: Capture and Route Leads Instantly
First things first: you have to grab leads the moment they come in. For most businesses running Google Ads, that initial form submission is the first win. But here’s the catch—speed is everything. A lead's value drops like a rock with every minute that passes.
Manually downloading leads from Google Ads and emailing them to your sales team is a recipe for disaster. It's slow, clumsy, and creates way too many opportunities for things to fall through the cracks.
Think about it: a user fills out a lead form on one of your ads. Right now, they're interested. An hour from now? They could be talking to your competitor. You have to move that information instantly.
This is where an integration tool becomes your best friend. These platforms act as a bridge, zapping lead data from Google Ads straight into your CRM the second it arrives. Your sales team gets a real-time ping, which drastically cuts down their response time and gives them a much better shot at closing the deal. To see how these setups work in more detail, check out our guide on PPC ad tracking.
Step 2: Enrich and Track Leads in Your CRM
Once a lead lands safely in your CRM, the real fun begins. Now you can move beyond just counting leads and start figuring out which ones are actually valuable. This is where you connect the dots between your marketing spend and your sales results.
Your CRM needs to be set up to mirror your sales process. You’ll want to create pipeline stages that show exactly where each lead is on its journey. Common stages look something like this:
- New Lead: Just arrived from Google Ads.
- Contacted: Sales has reached out.
- Qualified: This lead looks like a great fit.
- Proposal Sent: We've made them an offer.
- Closed-Won: It's a done deal!
By tracking leads through these stages, you’ll quickly see which Google Ads campaigns are sending you tire-kickers and which ones are delivering leads that turn into customers.
Step 3: Connect Your Data Sources for a Single View
Okay, it's time to bring all the pieces together. For a truly complete picture, you need to link your ad data (Google Ads), your website data (Google Analytics 4), and your sales data (your CRM). This is the foundation of a closed-loop reporting system.
GA4 has a fantastic feature that lets you import "offline" event data. By linking your CRM, you can push key sales milestones back into GA4 as new conversion events. Suddenly, you're not just seeing which ad generated a form fill; you're seeing which ad generated a qualified lead or, even better, a final sale.
This diagram shows the basic flow of turning raw marketing data into smart decisions, which is exactly what we're building here.
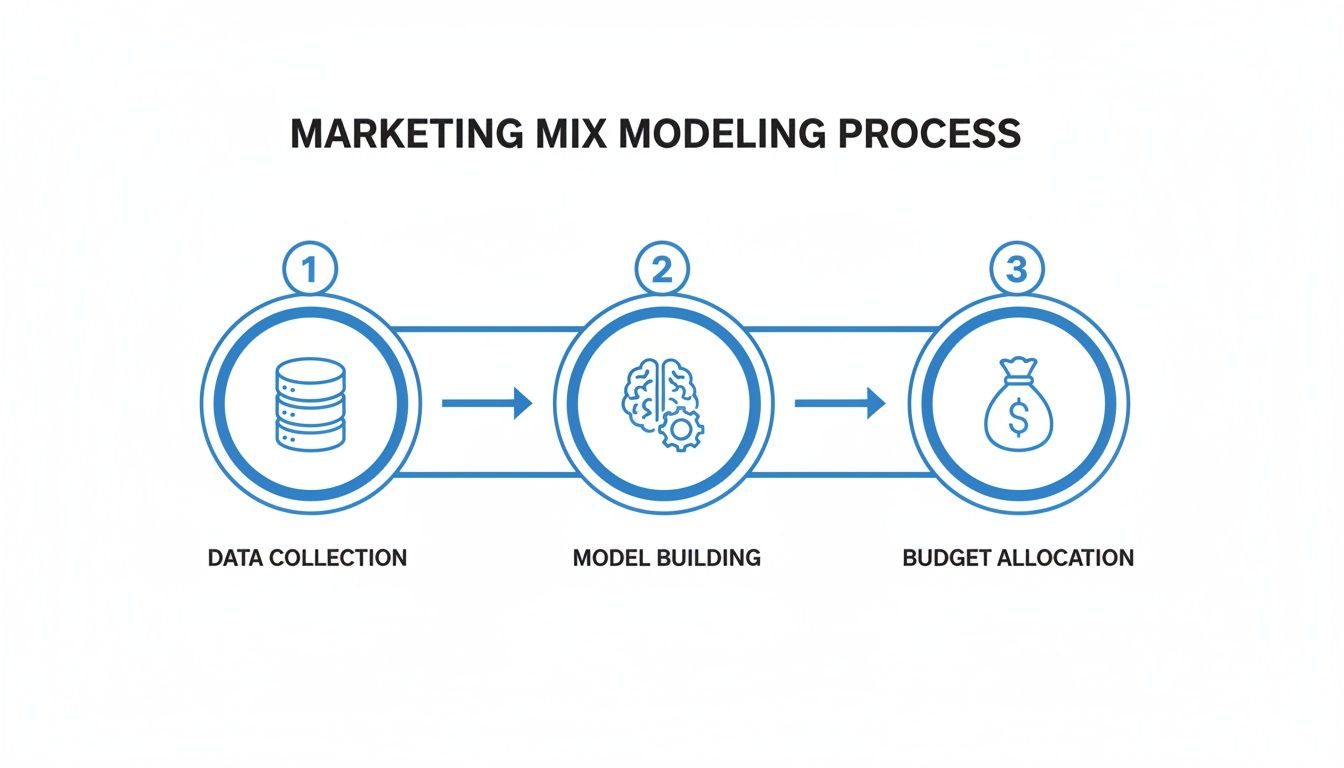
You can see how everything flows from data collection to modeling and then to smarter spending—that's the power of connecting your platforms.
Step 4: Implement Offline Conversion Tracking
This is the final and most important step. You need to feed your sales data back into Google Ads. The magic behind this is a feature called Offline Conversion Import. It’s your way of telling Google which ad clicks actually resulted in a sale that happened later in your CRM.
Here's a simple breakdown of how it works:
- Capture the GCLID: When someone clicks your ad, Google tags that visit with a unique ID called the Google Click Identifier (GCLID). Your job is to capture this ID and save it with the lead’s contact info in your CRM.
- Track Sales Milestones: When your sales team closes that lead, you log it in the CRM as a "Closed-Won" deal, along with the revenue it generated.
- Upload to Google Ads: Periodically, you upload a file to Google Ads containing the GCLID, the conversion name (like "Closed-Won"), and the dollar value of the sale.
This closes the loop completely. Google now knows the actual revenue tied to specific campaigns, ad groups, and keywords. This information supercharges Google’s Smart Bidding, allowing it to hunt for users who look like your best customers, not just people who fill out forms. If you want to get your hands dirty and learn the nuts and bolts of setting up tracking, exploring a workshop on practical pixel implementation can be a huge help.
Building an Actionable Google Ads Performance Dashboard

Let's be honest: raw data from Google Ads, GA4, and your CRM is just a jumble of numbers until you shape it into a clear story. This is where a good dashboard comes in. Think of it as your command center for advertising, translating all that complex data into something you can actually use to make smart decisions. And you don't need expensive software; a free tool like Looker Studio is perfect for the job.
The biggest mistake people make is trying to stuff every possible metric onto a single screen. The key is to build different views for different people. Your CEO needs a completely different report than the person managing the campaigns day-to-day.
The Executive Summary Dashboard
This is the 30,000-foot view, designed for your C-suite or stakeholders. They don’t have time for the nitty-gritty; they just want to know if their investment is paying off. This dashboard needs to be clean, simple, and focused on the big-picture results.
Your executive dashboard should answer key business questions at a glance:
- Total Marketing ROI: The ultimate bottom line. Are we making money from this?
- Customer Acquisition Cost (CAC): How much are we spending to get a new customer?
- Lead-to-Customer Rate: Are the leads we're generating actually turning into paying customers?
- Total Revenue from Ads: What's the final dollar figure we can attribute to our ad spend?
This report keeps high-level meetings focused on business growth, not on clicks and impressions.
The Tactical Campaign Dashboard
This is the in-the-trenches view for marketing managers and paid search specialists. It’s where the daily work of monitoring and optimizing campaigns happens. This dashboard needs to be more detailed and interactive, letting you slice and dice the data by campaign, ad group, or date range to see what’s really going on.
A great tactical dashboard doesn't just show what happened; it helps you understand why. It should provide enough detail to diagnose performance issues and identify opportunities for improvement without overwhelming the user.
Here, you'll want to see detailed breakdowns of Conversion Rate, Cost per Lead (CPL), and Return on Ad Spend (ROAS) for each campaign. Adding trend lines and charts is crucial, as they make it easy to spot if a campaign is suddenly tanking or, hopefully, taking off.
The Diagnostic Deep-Dive Dashboard
Every once in a while, you hit a problem you can’t solve with the tactical view. That’s when you pull out the diagnostic dashboard. Think of it as your analytics microscope, designed to help you zoom in and figure out complex issues.
This is where you can start blending data sources to find those "aha!" moments. For example, you could overlay GA4 engagement data on top of your Google Ads conversion data to see exactly how users are behaving before they convert. Or, you could pull in CRM data to see if leads from certain keywords are higher quality than others. This isn't a report you'll look at every day, but it’s an indispensable tool for troubleshooting tough problems and answering big strategic questions about your advertising effectiveness.
Frequently Asked Questions
Let's tackle some of the common questions that pop up when you're trying to figure out what's working—and what's not—in your Google Ads account.
How Can I Measure Brand Awareness Campaigns?
This is a great question because it's not as simple as tracking a sale. When you're running a brand awareness campaign, you're playing the long game. The goal isn't an immediate click or purchase, but to get your name in front of the right people.
Instead of looking at conversions, you need to shift your focus to metrics that show you're getting seen and remembered. Keep an eye on these:
- Impression Share: Think of this as your slice of the pie. It tells you what percentage of all possible impressions you're actually getting. A low number means you have room to grow.
- Reach and Frequency: This is pretty straightforward. Reach is the number of unique people who saw your ad, and frequency is how many times, on average, they saw it. You want high reach without an annoyingly high frequency.
- Brand Lift Studies: If you're running ads on YouTube, this is a fantastic tool. Google will actually survey users to see if your ads made a real impact on things like brand recall and consideration. It’s direct feedback on whether your message is sticking.
What Is the Difference Between Conversions and Conversion Value?
Getting this right is fundamental to understanding your true return on ad spend. It's the difference between being busy and being profitable.
A conversion is simply an action you care about. It could be someone filling out a form, calling your business, or downloading a guide. It's a simple count—a "yes, this happened" metric.
Conversion Value, on the other hand, puts a dollar amount on that action. Imagine you get 100 form submissions. A simple conversion count treats them all equally. But with conversion value, you might see that 10 of those leads were from enterprise clients worth $5,000 each, while the other 90 were from smaller businesses worth only $50 each. This context is everything, as it lets Google's Smart Bidding chase profit, not just a high volume of low-value leads.
How Long Does It Take to See Results from a Campaign?
This is the classic "it depends" answer, but for good reason. If you're running a straightforward e-commerce or lead generation campaign, you could start seeing conversion data trickle in within a few days or a week.
But for anything with a longer sales cycle—like B2B software or high-ticket services—it can easily take several months to get a clear picture. The biggest mistake you can make is pulling the plug too early. Give your campaigns at least a month to find their footing before making any major judgment calls.
Stop losing valuable leads from your Google Ads. Pushmylead instantly forwards lead form submissions directly to your inbox, so you can contact potential customers in seconds, not hours. See how it works at https://www.pushmylead.com.