
Google Ads reporting software takes all that raw, messy advertising data and turns it into clean, simple insights. It helps you understand what’s happening with your Google Ads campaigns without getting lost in spreadsheets. Think of it as a smart dashboard for your Google Ads account that tells you what's working, what isn't, and why.
What Is Google Ads Reporting Software and Why It Matters
Ever tried to fly a plane with thousands of confusing dials but no simple cockpit dashboard? That’s what managing a Google Ads account can feel like without the right tools. You’re swimming in a sea of raw data—clicks, impressions, costs, conversions—and it’s nearly impossible to see the big picture.
Google Ads reporting software is your cockpit dashboard. It automates all the tedious work of grabbing, organizing, and visualizing your campaign data. Instead of drowning in endless spreadsheets, you get clear, simple signals that tell you exactly how your ads are performing at a glance.
From Manual Chaos to Automated Clarity
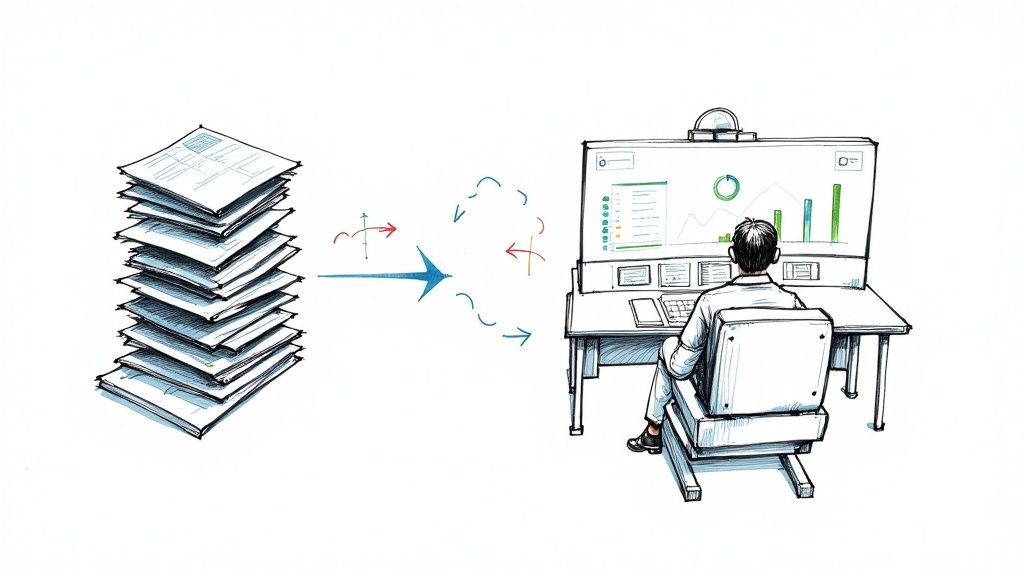
Not too long ago, marketers would spend hours manually exporting CSV files from Google Ads, pasting them into spreadsheets, and fighting with pivot tables just to build a basic performance report. This was not only painfully slow but also incredibly easy to mess up. A single copy-paste error could throw everything off, leading to bad decisions and wasted ad spend.
Modern Google Ads reporting software gets rid of all that manual chaos. It hooks directly into your Google Ads account (and other data sources), automatically pulling in the latest numbers and arranging them into visuals that actually make sense. This automation frees you up to do what you're best at: analyzing trends, refining your strategy, and making smart optimizations—not getting bogged down in data entry.
The core benefit is simple: these tools convert complex Google Ads data into clear stories. You stop managing spreadsheets and start managing strategy, making smarter decisions faster and driving real growth from your Google Ads investment.
The Growing Need for Smart Reporting
The world of digital advertising is more crowded and competitive than ever. The global Pay-Per-Click (PPC) software market was valued at USD 12.58 billion back in 2019 and is on track to hit USD 28.62 billion by 2027. That huge number shows just how much ad spend is out there and why it needs to be managed properly. You can dig into the numbers yourself in this detailed report on the PPC software market.
Relying on manual reporting today is like trying to drive across the country with a paper map instead of a GPS. It’s slow, outdated, and leaves you in the dust. In contrast, automated software gives you the real-time insights you need to:
- Quickly spot performance issues: Find underperforming ads or keywords before they burn through your budget.
- Identify growth opportunities: See which campaigns are hitting it out of the park and double down on them.
- Communicate value clearly: Show clients or your boss exactly how ad spend is impacting the bottom line with professional, data-backed reports.
The Core Features of Powerful Google Ads Reporting Tools
Not all reporting platforms are built the same. Some give you basic charts, while others are a strategic command center for your Google Ads campaigns. The key is knowing what separates a simple tool from one you can't live without.
Think of these features like the instruments in a pilot's cockpit. You need more than just a speedometer; you need an altimeter, a fuel gauge, and a navigation system to get where you're going. The best Google Ads reporting software gives you a full suite of these tools, each with a critical job.
Let's break down the must-have features that define a truly powerful reporting platform.
Customizable Dashboards and Automated Reporting
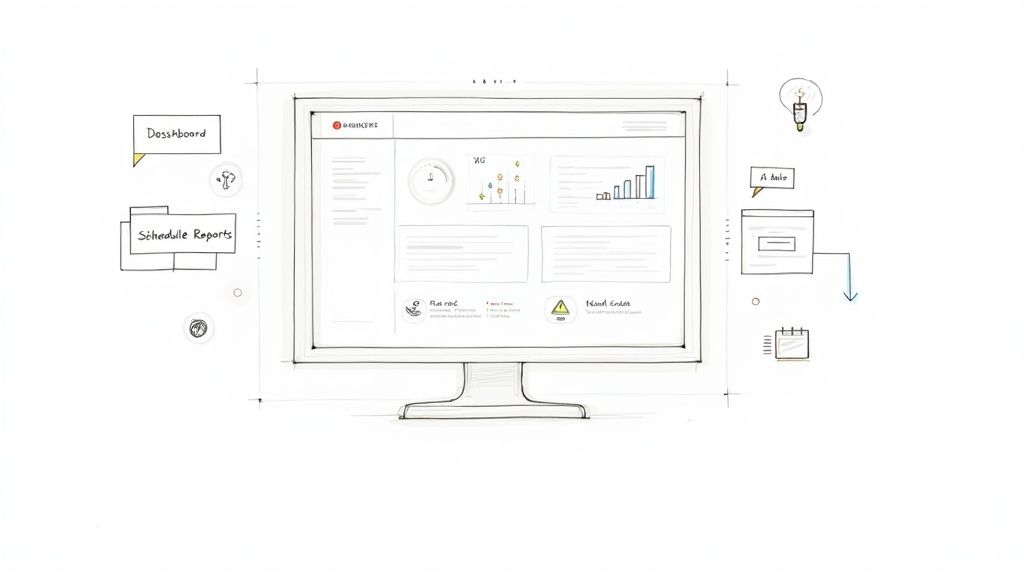
The heart of any great reporting tool is the dashboard. A static, one-size-fits-all view just doesn't cut it anymore. You need customizable dashboards that act as your mission control, giving you a real-time, high-level view of campaign health that's tailored to what matters most to you and your stakeholders.
This means you should be able to:
- Drag-and-drop widgets to arrange metrics in a way that tells a clear story.
- Create different dashboards for different audiences—a high-level ROAS view for an executive, and a granular, ad-group level report for a campaign manager.
- Visualize data with various chart types, from simple pie charts to complex trend lines that show performance over time.
Beyond the dashboard, automated report scheduling is an absolute game-changer. Instead of wasting hours each week pulling data, you can set up reports to be automatically generated and emailed to key people daily, weekly, or monthly. This feature alone reclaims countless hours that are much better spent on strategy and optimization.
Deep and Seamless Integrations
A reporting tool is only as good as the data it can pull. That's why deep integrations are so important. Your Google Ads reporting software must connect flawlessly not just with Google Ads, but with the whole ecosystem of tools you rely on.
A powerful reporting platform doesn't just pull data; it unifies it. By connecting Google Ads, Google Analytics, and your CRM, it creates a single source of truth, allowing you to trace ad spend directly to qualified leads and actual sales revenue.
Key integrations to look for include:
- Google Ads: This is the absolute minimum for pulling in campaign, ad group, keyword, and ad-level performance data.
- Google Analytics: Connecting to Google Analytics gives you crucial post-click data, showing how users behave on your site after they click an ad.
- CRM (e.g., Salesforce, HubSpot): This is the master key. Integrating your CRM, like Salesforce or HubSpot, connects ad spend to real business outcomes. It shows which campaigns are generating leads that actually turn into paying customers.
Without these connections, you’re flying blind and only seeing a fraction of the story.
Advanced Analytics and AI Capabilities
Top-tier tools go beyond just showing you the numbers; they help you figure out what the numbers mean. This is where advanced analytics come in. Features like cross-channel reporting are vital for mapping the entire customer journey, not just the final click in a Google Ad. It helps you understand how all your different marketing channels work together to drive conversions.
On top of that, the best modern platforms are now using AI to spot insights a human might miss. For example, AI-powered anomaly detection can automatically flag an unusual spike in cost-per-click or a sudden drop in conversion rates. This alerts you to potential problems before they become disasters.
These advanced features help you answer the tough questions, like:
- "Which ad creative is really driving the most conversions?"
- "Is my budget spread out effectively across all my campaigns?"
- "Are there performance issues I'm not seeing?"
By providing these answers, the software stops being just a reporting tool and becomes a strategic partner in your success.
Essential Features of Google Ads Reporting Software
To wrap it up, here's a quick-reference table of the features you should demand from any Google Ads reporting software you're considering. These aren't just "nice-to-haves"; they are the core components that enable you to manage and optimize your Google Ads campaigns effectively.
| Feature | Primary Benefit for Google Ads Management | Why It's Critical |
|---|---|---|
| Customizable Dashboards | Provides an at-a-glance, tailored view of the most important KPIs. | Allows for quick health checks and simplifies communication with stakeholders by focusing on what matters to them. |
| Automated Reporting | Saves hours of manual work by scheduling and sending reports automatically. | Frees up your time to focus on strategic analysis and optimization instead of repetitive data-pulling tasks. |
| Multi-Platform Integration | Connects data from Google Ads, Analytics, CRM, and other channels in one place. | Creates a single source of truth, allowing you to track ROI from the initial click all the way to a closed sale. |
| Advanced Analytics | Offers deeper insights like cross-channel attribution and performance trends. | Helps you understand the full customer journey and make smarter, data-driven decisions on budget allocation. |
| AI-Powered Insights | Automatically detects performance anomalies and optimization opportunities. | Acts as a second set of eyes, alerting you to problems or opportunities you might have otherwise missed. |
Choosing a tool with this full feature set ensures you have everything you need to not only report on your Google Ads performance but to actively improve it.
Tracking the Google Ads KPIs That Actually Matter
Having a powerful tool is only one piece of the puzzle. Knowing what to actually measure is what separates a good campaign from a great one. Your Google Ads reporting software can spit out hundreds of metrics, but focusing on the wrong ones is like celebrating how fast you’re driving without checking if you're even on the right road.
This is where Key Performance Indicators (KPIs) come into play. They’re the vital signs of your Google Ads campaigns. We’ll start with the day-to-day metrics that give you a pulse on ad performance, then zoom out to the big-picture numbers that connect your work directly to business growth.
Foundational Performance Metrics
Think of these KPIs as the immediate feedback you get from your ads. They tell you if your message is hitting the mark and if you’re paying a fair price for your audience's attention. A solid reporting tool will visualize these with clear trend lines, so you can spot problems or opportunities in a flash.
- Click-Through Rate (CTR): This is simply the percentage of people who click your ad after seeing it. A high CTR is a strong signal that your ad copy and keywords are lining up perfectly with what people are searching for.
- Cost Per Click (CPC): This shows the average amount you pay for a single click. Keeping a close eye on CPC helps you manage your budget and make sure you aren't overpaying for traffic.
- Conversion Rate: This is the big one for campaign-level performance. It measures the percentage of clicks that turn into a desired action, like a form submission or a sale. It’s the ultimate test of whether your landing page is doing its job.
These metrics don’t live in a vacuum—they all work together. A high CTR is fantastic, but not if the CPC is through the roof or if those clicks never convert. Good reporting software lets you see these relationships in a single dashboard, so you can make balanced decisions instead of chasing one metric at the expense of others.
Business-Focused Bottom-Line KPIs
While the foundational metrics are critical for the person running the campaigns, your CEO or finance team cares about a completely different set of numbers. These are the KPIs that tie your Google Ads spend directly to revenue and profit. They answer the only question that really matters to the C-suite: "Are we making money from this?"
The most impactful shift you can make in Google Ads management is moving from optimizing for clicks to optimizing for profit. KPIs like ROAS and CPA are the bridge that connects your campaign data to real business outcomes, telling a story that leadership actually understands.
With global search ad spend projected to hit USD 351.5 billion in 2025, the pressure to prove your worth has never been higher. Businesses are expected to spend around USD 58.21 per internet user on search ads, which means every single dollar has to count. This is where bottom-line KPIs shine, especially when you consider that 75% of users say paid search ads make it easier to find the information they want.
Let's break down the KPIs that truly define success:
-
Cost Per Acquisition (CPA): Sometimes called Cost Per Conversion, this is the total ad spend divided by the number of conversions. It tells you exactly how much it costs to get one new customer or qualified lead. Your goal should always be to keep this number well below the value that a new customer brings in.
-
Return on Ad Spend (ROAS): This is arguably the most important metric for any business selling a product or service via Google Ads. It measures the gross revenue you generate for every dollar you put into advertising. A ROAS of 4:1, for instance, means you’re making $4 for every $1 you spend. Simple and powerful.
-
Customer Lifetime Value (CLV): This is a more advanced metric that forecasts the total revenue you can expect from a single customer over their entire relationship with your business. By integrating your CRM with your Google Ads reporting software, you can start to see which campaigns are bringing in not just one-time buyers, but high-value, long-term customers. For tracking this accurately, a deep understanding of using Google Analytics UTM parameters is essential to pass the right data between systems.
When you start focusing on these KPIs, you graduate from just reporting on clicks and impressions. You begin telling a compelling story about how your Google Ads campaigns are a vital engine for growing the entire business.
Choosing the Right Google Ads Reporting Software for Your Needs
Picking a new tool for your marketing stack can feel overwhelming. With so many options out there, it's easy to get lost in a sea of feature lists and pricing plans. The secret is to step back and create a simple, practical checklist to guide your search. This way, you can be sure the software you choose is a perfect fit for your business goals and how your team actually works.
The right Google Ads reporting software should feel like a natural extension of your team, not just another complicated system to learn. It needs to make your life easier, give you clear insights, and ultimately help you make smarter, more profitable decisions in your Google Ads campaigns.
Define Your Core Requirements First
Before you even start looking at software websites, the first step is to look inward. What are the absolute must-haves for your team? Getting this down on paper first stops you from getting distracted by flashy features you'll probably never use.
Start by making a simple "must-have" list. Think about these key areas:
- Effortless Integrations: Does it connect easily with all the tools you already use? This isn't just about Google Ads and Google Analytics. Think about your CRM, social media ad platforms, and any other places you pull data from.
- Room to Grow: Will this tool grow with your business? A platform that works great for a $5,000 monthly ad spend might fall apart under the pressure of a $50,000 budget. Think about where you're headed, not just where you are today.
- Is It Easy to Use?: Seriously, is the platform intuitive? If your team finds it clunky or confusing, they just won't use it, and you'll have wasted your money. A clean, user-friendly design is non-negotiable.
The goal isn't to find the software with the most features; it's to find the one with the right features for you. A simple tool that solves your biggest reporting headaches is far more valuable than a complex platform that creates new ones.
Evaluate Based on Business Impact
Let's talk numbers for a second. In 2025, Google Ads is expected to hold a massive 29% market share in the advertising software world. This just underscores how critical it is to pick reporting tools that integrate deeply and reliably with Google’s ecosystem. And since 93% of marketers say PPC is highly effective, the software you choose has to be powerful enough to analyze performance in detail and justify an investment that often brings in $2 for every $1 spent. To dig deeper into these trends, you can learn more about the PPC software market dynamics.
This context should shape how you judge a tool. Its real value isn't just in the pretty reports it makes, but in the strategic conversations it starts. Can it clearly show the return on ad spend to your boss? Does it help your campaign managers spot ways to improve performance faster? These are the questions that connect a software purchase to real business growth.
To help you stay focused on what truly matters, we've put together a checklist. Use this table to compare different software options side-by-side and keep your evaluation grounded in your specific business needs.
Google Ads Reporting Software Evaluation Checklist
| Evaluation Criterion | Question to Ask | Importance Level (High/Medium/Low) |
|---|---|---|
| Data Integration | Does it connect to all my essential platforms (Google Ads, Analytics, CRM, Social)? | High |
| Customization | Can I build reports and dashboards that match our unique KPIs and branding? | High |
| Ease of Use | Is the interface intuitive enough for the whole team to use without extensive training? | High |
| Scalability | Can the software handle our projected growth in ad spend and campaign complexity? | Medium |
| Automation | Does it automate report scheduling and delivery to stakeholders? | High |
| Customer Support | Is there responsive and helpful support available when we run into issues? | Medium |
| Pricing Model | Is the pricing clear, predictable, and a good value for the features provided? | High |
| Lead Form Integration | Can it directly integrate with Google Ads lead forms for real-time data? | Medium |
After you've run a few contenders through this checklist, you should have a much clearer picture of which one is the best fit.
Run an Effective Free Trial
A demo is one thing, but a free trial is where you find out the truth. This is your chance to see how the software performs with your own, real-world Google Ads data. Don’t just poke around—use the trial period to complete specific, important tasks.
Here’s a quick game plan for your trial period:
- Connect Your Main Data Sources: Start by linking your primary Google Ads account. Pay attention to how easy or frustrating the process is.
- Recreate an Existing Report: Grab one of your current manual reports and try to build it in the new software. This is the best way to directly compare your old workflow to the new one.
- Invite a Teammate: Ask a colleague to log in and give you their honest feedback on the experience without any coaching.
- Test Out Customer Support: Find a real question and send it to their support team. How quickly and helpfully they respond will tell you a lot about the company.
By following a structured approach, you can cut through the sales pitches and confidently choose a Google Ads reporting software that truly fits your team’s needs, budget, and long-term goals.
Bridging the Gap: From Google Ads Reports to Real-Time Leads
A great report tells you what’s working in your Google Ads campaigns. But what happens after a lead converts? How do you capitalize on that success the second it happens? This is where your reporting strategy needs to connect with the real world of sales, especially when leads are your lifeblood.
Let's be honest, even the best report showing a sky-high conversion rate from your Google Ads Lead Forms is just a piece of paper. Behind that data are real people—potential customers who are waiting for you to get in touch. The old-school way of handling these leads is a huge, often invisible, drain on your ROI.
The Old Way: A Recipe for Lost Opportunities
For far too long, the standard routine has been a manual slog. You log into Google Ads, find the right campaign, and download a CSV file of your new leads. Maybe you do this once a day, maybe less if you're swamped.
This manual process creates a killer delay. A prospect who fills out your form at 9 AM on Tuesday might not hear from your sales team until Wednesday afternoon. In that 24-hour gap, their initial excitement has faded, they’ve already started looking at your competitors, and your chance of actually connecting with them has plummeted.
It's a well-known fact in sales: your odds of qualifying a lead drop off a cliff after the first five minutes. The manual CSV download method basically ensures you miss this golden window, turning hot prospects into cold, missed opportunities.
This workflow is a holdover from a much slower era. While your Google Ads reporting software is busy crunching long-term performance data, this simple operational bottleneck is actively sabotaging the very success your reports are showing.
The Modern Fix: Instant Lead Delivery
The solution is to separate your big-picture analysis from your immediate, need-for-speed actions. This is where real-time lead delivery tools come in. Think of them as a high-speed bridge connecting your Google Ads campaigns directly to your sales team.
Instead of waiting around for someone to download a file, an automation tool grabs a new lead from your Google Ads Lead Form the instant it’s submitted. It then zips that contact info directly to where your sales team actually works—whether that's their CRM, email inbox, or a dedicated Slack channel.
This simple infographic breaks down how you can approach choosing the right tools for your marketing toolkit.
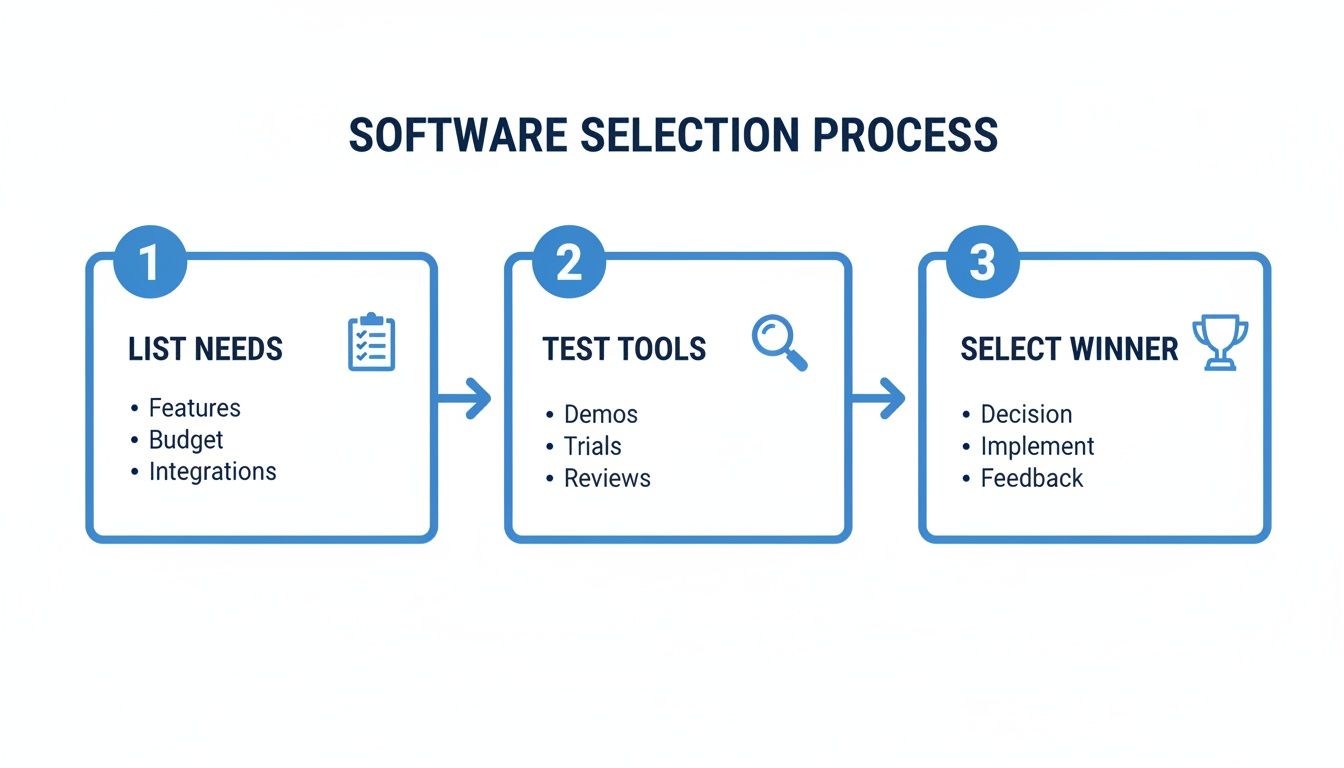
It highlights a common-sense approach: figure out what you need, check out the tools available, and then make a smart decision. This ensures the software you pick is solving a real business problem, like getting leads to your sales team faster.
Getting the Most from Every Lead with Automation
Tools like Pushmylead were built specifically to fix this problem. They make sure that a lead from your Google Ads campaigns never has a chance to go cold. You can dig deeper into how data and action should work hand-in-hand in our guide on reporting for Adwords.
Let's look at how this plays out in the real world:
- Scenario A (The Old Way): Someone submits your lead form at 10:00 AM. The marketing team downloads the CSV the next morning at 10:30 AM and emails it to sales. A salesperson finally calls the lead at 2:00 PM—a 28-hour delay. Ouch.
- Scenario B (With Automation): Someone submits your lead form at 10:00 AM. Pushmylead instantly routes the lead to the sales team's CRM and sends them a notification. A salesperson is on the phone with the lead by 10:02 AM—a 2-minute response.
The difference in outcomes between these two scenarios is night and day. The second approach gets the absolute maximum value from every single lead your campaigns bring in. By connecting your Google Ads account to an instant delivery system, you ensure the great results you see in your reports turn into actual conversations—and more revenue.
Here's the rewritten section, designed to sound completely human and natural:
Getting the Most Out of Your Google Ads Reporting Software
So you've invested in a powerful reporting tool. That’s a great first step, but the real magic doesn't happen when you sign up. It happens when you weave the tool into the very fabric of your team's daily workflow. Think of it like this: buying a top-of-the-line engine doesn't automatically win you the race. You still need a skilled driver and a solid strategy.
This is your playbook for turning that software from just another subscription into the nerve center for all your Google Ads decisions. It all starts by ditching the generic, one-size-fits-all reports. Different people on your team need to see different data, and your reports should reflect that.
Build Reports for the Right Audience
Your CEO doesn't care about the nitty-gritty of keyword-level cost-per-click. They want the big picture—the story of your return on investment. Your campaign managers, on the other hand, live and breathe those granular details. A smart reporting strategy serves both.
- For the C-Suite: Keep it clean and high-level. Build a dashboard that focuses on the metrics that matter to the bottom line, like overall Return on Ad Spend (ROAS), total conversions, and Cost Per Acquisition (CPA). Use simple charts to show trends over time.
- For Campaign Managers: This is where you get granular. Their reports should be packed with actionable data like Click-Through Rate (CTR) by ad group, Quality Score changes, and performance broken down by device or location. This is the information they need to make smart optimizations every single day.
When you create these distinct views, every conversation about performance becomes more focused and productive. Executives get the strategic overview they need for budget talks, and managers get the tactical data they need to drive better results.
Get Ahead of Problems with Smart Alerts
If you’re waiting for a weekly report to find out something’s gone wrong, you're already behind. That's just a recipe for wasted ad spend. The key is to shift from being reactive to proactive, and that's where intelligent alerts come in.
Instead of your team having to manually hunt for problems, you can set up automated notifications that fire off the second a key metric goes off track.
Think of alerts as your 24/7 watchdog for Google Ads. They never sleep, constantly monitoring performance so you can spot and solve issues before they turn into major headaches.
For instance, you could set up an alert for:
- A sudden 20% spike in Cost Per Click (CPC) on a key campaign.
- A conversion rate that drops below your baseline for more than two days.
- An ad group that burns through 75% of its monthly budget in the first week.
These alerts transform your team from data archaeologists, digging through past performance, into campaign firefighters, putting out small sparks before they become infernos. This proactive approach keeps your budget working efficiently and directly boosts your return on investment.
Common Questions About Google Ads Reporting Software
To wrap things up, let's tackle a few of the most common questions that come up when people start looking into Google Ads reporting software. Getting these answers straight can make the decision-making process a whole lot clearer.
Is Google Data Studio Enough for Google Ads Reporting?
While Google Data Studio (now Looker Studio) is a great free tool for whipping up basic dashboards, it often hits a wall. For anything complex, you're looking at a ton of manual setup, wrestling with data connectors that can be flaky, and missing out on advanced features like multi-touch attribution right out of the gate.
A dedicated reporting tool is built for efficiency. It offers stable, plug-and-play integrations and ready-made templates that will save you a massive amount of time.
How Much Does Google Ads Reporting Software Cost?
The price tag on these tools is all over the map. Some platforms have a simple flat monthly fee, while others calculate their pricing based on things like:
- The number of ad accounts or data sources you link up.
- Your total monthly ad spend.
- How many users need access.
You can find plans for under $50 per month that work well for freelancers, but agencies needing all the bells and whistles could be looking at several hundred dollars. Just make sure you read the fine print for any hidden fees or lengthy contract commitments.
Can These Tools Actually Track Full ROI?
Absolutely, but there’s a catch: they need to talk to your CRM. The best Google Ads reporting software will connect your Google Ads cost data directly with your sales data from a platform like HubSpot or Salesforce.
This integration is the magic key to tracking true Return on Investment (ROI). It finally bridges the gap between someone clicking an ad and becoming a paying customer, showing you which campaigns are actually making money for the business.
Without that link, you're just counting leads, not measuring the real financial impact of your ads. This connection turns a simple marketing summary into a document that drives smart business decisions.
Ready to stop leads from going cold? Pushmylead delivers them from your Google Ads campaigns to your sales team in real time. Learn more about how Pushmylead works.