
Let's face it: if you're still manually crunching Google Ads data in spreadsheets, you're fighting a losing battle. It’s not just about the tedious hours spent copying and pasting; it's about the bigger picture you're missing.
Effective reporting isn't a chore. It's about building a system that automatically connects your ad spend to actual business results, giving you the real-time insights needed to prove your campaigns are delivering a genuine return on investment (ROI). This guide will walk you through setting up a robust reporting framework within the Google Ads ecosystem, packed with valuable data and actionable tips.
Why Manual Google Ads Reporting Is Holding You Back
We’ve all been there—staring at a massive spreadsheet, trying to piece together the story of last month's campaign performance. This old-school method is riddled with problems. Simple human errors, like a misplaced decimal or a broken formula, can completely skew your data and lead you down the wrong path.
This creates a frustrating gap between what you're spending on ads and the revenue you're actually generating. You end up making decisions based on outdated information, which is a recipe for wasted budget. By the time you spot an underperforming keyword or ad group, the damage is already done.
The True Cost of Inefficient Reporting
The real cost here isn't just the time your team is losing to data entry. It’s the lost opportunities. When your sharpest strategists are bogged down in spreadsheets, they aren't spending their time optimizing campaigns, testing new creative, or finding new ways to grow the business.
An automated system completely flips the script. Think about what that unlocks:
- Real-time Insights: You can make smart, fast decisions based on what’s happening right now, not last week.
- Accurate ROI Proof: Directly connect ad spend to every lead and sale, leaving no doubt about the value you’re delivering.
- Strategic Focus: Your team is freed up to work on what actually moves the needle—improving performance and driving growth.
From Manual Drudgery to Strategic Advantage
When you connect your lead forms directly to a live dashboard, you create an unbreakable link between your Google Ads efforts and real business outcomes. This is no longer a "nice-to-have"; it's essential for staying competitive.
For example, look at the latest Google Ads benchmarks. The average conversion rate across all industries sits at 7.52%. But that figure swings wildly, from 4.84% in Arts & Entertainment to 7.76% in Automotive. Without accurate, up-to-the-minute data, how can you know where you stand and what to aim for? You can dig deeper into how to evaluate your campaign efficiency with detailed 2025 Google Ads benchmarks.
Automation transforms reporting from a backward-looking administrative task into your most powerful forward-looking tool. It’s how you build a system that not only saves countless hours but also gives you the clarity to scale your campaigns with confidence.
Setting Up Your Lead Capture Foundation
Any automated reporting system is only as good as the data you feed it. You can build the most beautiful dashboard in the world, but if it’s running on bad or incomplete information, it's completely useless. That's why getting your data capture right from the very beginning is the single most important part of this whole process.
It all boils down to how you collect information from potential customers. This is where Google Ads lead form extensions really shine. They let you grab user details right from your search, discovery, or YouTube ads, which cuts down on friction and almost always bumps up your lead volume.
Configuring Google Ads Lead Form Extensions
Let’s imagine a local plumbing company running an ad for "emergency pipe repair." Instead of making someone click through to a landing page (where they could easily get distracted), a lead form extension lets them ask for a quote directly within the ad. It’s a much smoother experience.
Getting this set up is pretty simple:
- First, head into the campaign you want to add the extension to.
- From there, navigate to ‘Ads & assets,’ click on ‘Assets,’ and hit the blue ‘+’ button.
- Select ‘Lead form’ and start building it out. You'll need a headline, your business name, and the questions you want to ask, like Name, Phone, Email, and what kind of service they need.
This setup is the first link in your data chain. But honestly, it's only half the battle. Capturing the lead is great, but connecting that lead back to the exact ad that brought them in? That’s what makes truly smart reporting for adwords possible.
This is the goal: moving from messy, manual spreadsheets to a clean, automated dashboard that tells you everything you need to know at a glance.

Automation is what gets you there, turning raw data into real insights so you can stop wasting time and start making better decisions.
The Critical Role of Offline Conversion Tracking
The real magic happens when you start tracking what happens after someone fills out your form. Did that plumbing quote turn into a $1,500 job? Which specific keyword brought in that high-value customer? To answer these questions, you need to be using offline conversion tracking.
The entire process hinges on the GCLID (Google Click ID). This is a unique string of characters that Google adds to the URL whenever someone clicks your ad. Your system absolutely must capture and save this GCLID along with the rest of the lead’s information.
Key Takeaway: The GCLID is the golden ticket for accurate attribution. If you fail to capture it the moment a lead comes in, you lose the ability to ever connect a future sale back to its source in Google Ads. It's an all-or-nothing piece of data.
Fast forward a bit. The plumbing company's team closes the deal. They update their CRM or spreadsheet to mark that lead as "won" and log the revenue. The next step is to upload this conversion data—including the original GCLID—back into Google Ads.
Google then does its part, matching that GCLID to the original click, campaign, ad group, and keyword. All of a sudden, your Google Ads dashboard isn't just showing you leads; it's showing you actual revenue. You can now see with certainty that the keyword "emergency pipe repair near me" didn't just generate a lead—it generated a $1,500 conversion. That's a powerful return on your ad spend.
This foundational setup isn't optional for any serious advertiser. It's what turns your ad account from a simple lead generator into a genuine business intelligence tool. Without it, you're just flying blind.
Getting lead information from your Google Ads campaign is a great start, but it's only half the battle. For that data to actually mean something, you have to get it to your sales and marketing teams—fast. Manually downloading lead forms is a recipe for delays, and in the world of sales, every minute counts. The chance of converting a lead plummets almost immediately after they submit their info.
Automating this whole process is the key. It ensures that every new prospect is in your pipeline and getting attention right away, bridging the gap between your ad spend and actual sales. This is a non-negotiable step for building an effective reporting system, as it ties campaign clicks directly to tangible business results.
Picking the Right Tool for the Job
There are a few solid ways to get this data moving automatically, and your choice will probably depend on the tools you already use. The good news is you don't need to be a coding wizard; most of these solutions are built for marketers.
Here are the most common ways I've seen this done well:
- Webhooks: This is the most direct route for instant data delivery. Think of a webhook as a simple notification that fires off lead data to a specific URL the second it's captured. Most CRMs, like HubSpot or Salesforce, will give you a webhook URL you can just copy and paste right into your Google Ads lead form settings.
- Third-Party Connectors: Tools like Zapier or Make are the swiss army knives of automation. They act as a go-between for thousands of different apps, letting you build some incredibly powerful workflows without touching a line of code.
- Specialized Tools: Some platforms, like our own Pushmylead, were created specifically to solve this one problem. They're designed to simply forward leads from your campaigns straight to an email inbox or another system.
You can still download a CSV of your leads from Google, of course, but think of it as your emergency backup. If you're relying on manual downloads, you're just reintroducing the delays and potential for human error you were trying to fix.
A Real-World Automation Workflow
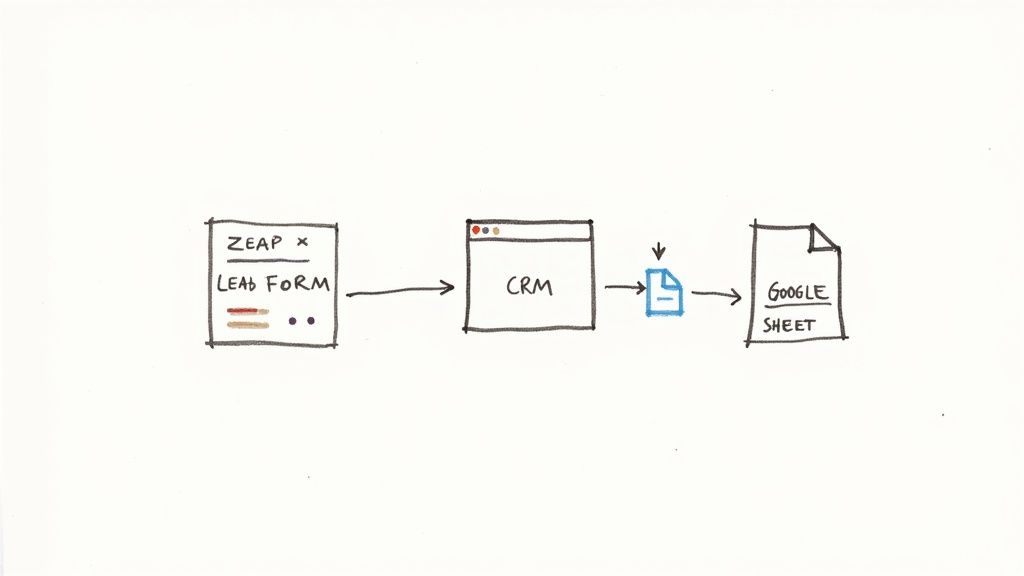
Let’s imagine a typical agency scenario. You need to send new leads from a Google Ads campaign into a shared Google Sheet for the client to see, and also into their CRM for the sales team to work on. A critical part of automating your reporting is setting up efficient automated data processing to manage and organize advertising data coming from different places.
Using a tool like Zapier, this is pretty straightforward.
First, you set your trigger. In this case, the trigger is a "New Lead" from a specific Google Ads lead form. You just connect your Google Ads account and pick the form you want to watch.
Next, you define your first action: "Create a New Row" in a Google Sheet. You’ll then match the fields from your lead form—like Name, Email, Phone, and the all-important GCLID—to the right columns in your sheet. Easy.
Then, you can tack on a second action to the same workflow. This time, the action is to "Create a New Contact" in a CRM like HubSpot. Just like before, you map the same lead information to the contact fields in the CRM.
The best part? Once you set this up, it just works. Every single time a new lead comes in, both the Google Sheet and the CRM are updated in a matter of seconds. It creates a completely hands-off, real-time flow of data.
This type of automation is the engine that drives modern campaign management. It not only gets leads followed up on immediately but also populates the databases you'll need for your final reporting dashboard—which is where the real insights happen.
Building Your Automated Reporting Dashboard
You've done the hard work of capturing leads and tracking conversions. Now it's time for the payoff: turning all that raw data into something your clients or stakeholders can actually understand and get excited about. We're going to build a live, automated dashboard that tells the real story of your campaign performance.
For this, Looker Studio (what we all used to call Google Data Studio) is our tool of choice. The goal here is to ditch the clunky, static spreadsheets for good. We want a dynamic report that instantly answers the big questions: What's our cost per qualified lead? Are we actually making money from this ad spend? A solid dashboard makes these answers jump right off the page.
Connecting Your Data Sources
First things first, we need to get our data into Looker Studio. The beauty of using the Google ecosystem is how well everything plays together. Since your lead data is already flowing into a Google Sheet, this part is a breeze.
Inside Looker Studio, you'll simply create a new data source and choose "Google Sheets." From there, just point it to the sheet where you’ve been collecting all that valuable lead and conversion data. Looker Studio pulls everything in, and—this is the magic part—it creates a live connection. Every time a new lead hits your sheet, your dashboard updates. No more manual exports.
This is a massive leap from the old way of doing things, where you'd be stuck looking at last week's (or last month's!) numbers. With real-time data, you can react instantly to what's happening, not what happened.
Here's an idea of what a clean, effective dashboard can look like.

See how it uses simple scorecards and charts? That’s how you make complex data easy for anyone to grasp in seconds.
Choosing Your Google Ads Reporting Tool
While we're focusing on Looker Studio, it's not the only game in town. Depending on your needs, budget, and technical comfort level, another tool might be a better fit. Here's a quick rundown of the most common options.
| Tool | Best For | Key Features | Cost |
|---|---|---|---|
| Looker Studio | Startups, small businesses, and agencies looking for a powerful, free solution within the Google ecosystem. | Native Google connectors, highly customizable, easy to share, completely free. | Free |
| Google Sheets | Quick, no-frills analysis and simple dashboards for those who live and breathe spreadsheets. | Pivot tables, built-in charts, extreme flexibility for data manipulation. | Free |
| Microsoft Power BI | Businesses heavily invested in the Microsoft ecosystem or needing advanced data modeling and business intelligence. | Powerful data modeling (DAX), deep integration with Excel and Azure. | Starts with a free version; Pro version is per user/month. |
| Tableau | Data-heavy organizations and analysts who need sophisticated and visually stunning data storytelling capabilities. | Best-in-class data visualization, connects to virtually any data source. | Premium pricing, often per user/year. |
Ultimately, Looker Studio is the perfect starting point for most Google Ads reporting because it's free, powerful, and integrates flawlessly with Google Sheets and Google Ads. But as your needs grow, it's good to know what else is out there.
Designing a Report That Tells a Story
A great dashboard does more than just display numbers; it guides the viewer's eye to what really matters. Think of it as a visual narrative. The key is to keep it clean and focused on your most important Key Performance Indicators (KPIs).
Here are the non-negotiable elements every one of my Google Ads dashboards includes:
- KPI Scorecards: Put the big numbers front and center. Cost Per Lead (CPL), Total Conversions, Conversion Rate, and Return on Ad Spend (ROAS) should be impossible to miss.
- Time Series Charts: Use a simple line or bar chart to show how metrics like clicks, cost, and conversions have changed over time. This is the easiest way to spot trends, seasonality, or the impact of a new campaign launch.
- Breakdown Tables: A table is perfect for digging into the details. I always include one to break down performance by campaign, ad group, or keyword so we can see exactly what's working and what's not.
- An Interactive Date Filter: This is an absolute must. It lets anyone viewing the report—from the CEO to the marketing intern—easily select the time period they care about, whether it's the last 7 days or all of last quarter.
If you're staring at a blank canvas and not sure where to start, don't worry. There are some excellent PPC reporting templates out there that can give you a solid foundation. We've also put together some of our own favorites to get you up and running faster, which you can check out here: https://www.pushmylead.com/ppc-reporting-templates/
My best advice: Design for the person who will be reading the report, not for yourself. Use clear labels, add little notes explaining what each chart represents, and stick to a clean, professional look.
Automating and Scheduling Your Reports
With your dashboard built, the final piece of the puzzle is to make the reporting process completely hands-off. Looker Studio’s scheduling feature is perfect for this.
You can set it up to automatically email a PDF of the report to your client or boss every Monday morning, on the first of the month, or whatever cadence makes sense. This one feature is a game-changer for agency life and in-house teams. Stakeholders get consistent, timely updates delivered right to their inbox, and you're freed from the tedious task of manually compiling and sending reports. It keeps everyone in the loop without you lifting a finger.
Dealing with the Inevitable: Troubleshooting Your Reporting
https://www.youtube.com/embed/HH2xnMqIrM0
Even the most buttoned-up automated system will hit a snag eventually. It's just a fact of life. Data feeds break, tracking scripts misfire, and dashboards will show numbers that just don't feel right. The real skill isn't building a system that never fails—it's knowing exactly what to do when it does.
This is especially true when you're an agency managing multiple client accounts. Accuracy and trust are your currency. Knowing how to proactively troubleshoot is what separates the good account managers from the great ones. When you can pinpoint and fix an issue fast, you’re not just saving the data; you're reinforcing your value to your client.
What to Do When Conversion Tracking Goes Dark
One of the most heart-stopping moments is when your conversions just stop tracking. The dashboard flatlines, but you know for a fact that leads are still coming in. Don't panic. Just work backward from the conversion point to find the break in the chain.
- Check the upload first. If you’re using offline conversion tracking, dive into Google Ads and check your upload history. Is the system still successfully sending conversion data back to the platform? Any errors here are your first clue.
- Then, inspect your data source. Pop open your Google Sheet or CRM. Are new leads still appearing with their GCLIDs intact? If that GCLID column is suddenly empty, the problem is happening earlier—somewhere between your lead form and your database.
- Finally, test the form yourself. This is the simplest and often most revealing step. Go to your client's website, fill out the form, and then trace its journey. See if your test lead shows up in the Google Sheet with a GCLID. This will almost always show you exactly where things went wrong.
I can't stress this enough: the GCLID is the lynchpin of this entire process. In my experience, 99% of tracking issues with offline conversions boil down to a problem with capturing, storing, or passing this one critical parameter.
Unraveling Why the Numbers Don't Match
So, your tracking is working, but the numbers just don't add up. Your CRM is proudly reporting 50 sales, but Google Ads is only showing 40 conversions. This kind of discrepancy can kill client confidence if you can't explain it.
The most common culprit is almost always the conversion window. If your Google Ads conversion window is set to 30 days, but a sale closes on day 35, Google won’t count it—but your CRM will. Make sure your attribution windows are aligned across every platform you use.
Cross-device conversions also muddy the waters. A user might click an ad on their phone during their commute and then fill out the form on their desktop at work. Google is pretty savvy at connecting these dots, but your internal systems might not be, leading to mismatched numbers.
To help with this, Google Ads recently added the 'Original Conversion Value' metric, which is a huge help for diagnostics. It shows you the raw, unadjusted conversion value generated by your campaigns before any value rules or other automated adjustments kick in. If your reported ROAS looks fantastic but the 'Original Conversion Value' is much lower, you know that bidding adjustments are inflating the final number. This transparency is a game-changer for agencies needing to prove that their strategies are driving real value, not just reported value. You can read more about this new Google Ads conversion metric on Search Engine Land.
Keeping Your Dashboards Healthy and Secure
Your automated dashboard is a living thing, and it needs a little TLC now and then. A data source connection can easily break because of something as simple as a changed password or updated permissions, which will plaster your beautiful charts with error messages.
The fix is usually simple. In Looker Studio, just navigate to Resource > Manage added data sources. You'll see the broken connection there. Click "Edit," re-authenticate with the new credentials, and you're back in business. I’d recommend making this a quarterly health check as part of your standard account maintenance.
Client access is another key part of dashboard management, especially for agencies.
- Viewer Access: Always give clients "Viewer" permissions. This lets them explore the data and change date ranges without any risk of them accidentally breaking your charts or filters.
- Editor Access: Reserve "Editor" access for internal team members who are actually building or maintaining the report.
- Data Source Permissions: Remember that sharing a report might also mean you need to share access to the Google Sheet behind it. Always double-check what level of data access is appropriate before you hit send.
Following these simple troubleshooting routines will keep your reporting for adwords running smoothly, ensuring your data remains the rock-solid source of truth you and your clients depend on.
Common Questions Answered
Switching from manual spreadsheets to an automated reporting system is a big step, and it's natural to have a few questions. Getting a handle on the common hurdles and strategic details will give you the confidence to build a system that works.
Here are the questions that come up most often, with straight-to-the-point answers based on what we've seen in the real world.
How Long Does This Actually Take to Set Up?
The honest answer? It depends.
For a simple setup—connecting a Google Ads lead form to Google Sheets and then into a Looker Studio dashboard—you could be up and running in a few hours. It’s a pretty straightforward path to getting immediate value.
But if you're dealing with a more complex situation, like integrating with a custom CRM or mapping out detailed offline conversion goals, you'll want to set aside a day or two. This gives you enough time to get everything configured, tested, and running smoothly.
The crucial thing to remember is that this is a one-time setup. You're investing a bit of time now to save countless hours later. That weekly reporting grind that used to take hours will soon become a quick five-minute review.
What's the Single Biggest Mistake People Make with Offline Conversion Tracking?
This one is easy. By far, the most common and costly error is failing to capture the GCLID (Google Click ID) for every single lead. No exceptions.
Think of the GCLID as the unique fingerprint connecting a user's ad click to their conversion. If it gets lost anywhere in the process—from the form submission to your CRM—that lead becomes an attribution ghost. You simply can't tie it back to the specific campaign, ad group, or keyword that generated it.
Make it a top priority to ensure every tool in your chain (your forms, your CRM, any middleware) is set up to grab and pass along this vital piece of data. Test your lead flow regularly to make sure nothing is broken.
Can I Get Phone Calls into This System?
Absolutely. In fact, if you're not tracking calls, you're missing a huge piece of the puzzle.
To get phone call data into your reports, you'll need a call tracking service like CallRail or WhatConverts. These tools integrate directly with Google Ads and do the heavy lifting for you.
Here’s the basic flow:
- The service puts a unique, trackable phone number on your website or in your ads for each visitor.
- When someone calls, the platform captures the GCLID from their session.
- The call data, along with that all-important GCLID, is then sent back to Google Ads as an offline conversion.
Once that's done, you can pull your call data right into your Looker Studio dashboard next to your form fills. This gives you one unified view of every single lead you're generating.
How Do I Sell My Client on This?
When you're talking to a client, don't focus on the setup process. Focus on the value. This isn't just another agency expense; it's a strategic investment that leads to smarter decisions and better results.
Explain that an automated system for reporting for adwords delivers three huge wins:
- Trustworthy Data: It completely eliminates the human error that creeps into manual spreadsheets.
- Real-Time Insights: No more waiting for a weekly report. You can both see what’s working right now and make faster, more effective changes.
- True ROI: It proves the exact value of their ad spend, right down to the keyword level.
The final selling point is about your time. Remind them that this system frees you up from tedious report-building so you can focus on what they hired you for: strategic campaign optimization that actually grows their business. Showing them a quick demo of a finished dashboard is usually all it takes to get them on board.
At Pushmylead, we handle the very first step of this automation process for you. Our tool instantly sends leads from your Google Ads forms straight to your email, so you can stop downloading CSVs and start acting on new leads the moment they arrive. Learn more about how to simplify your lead management with our tool.